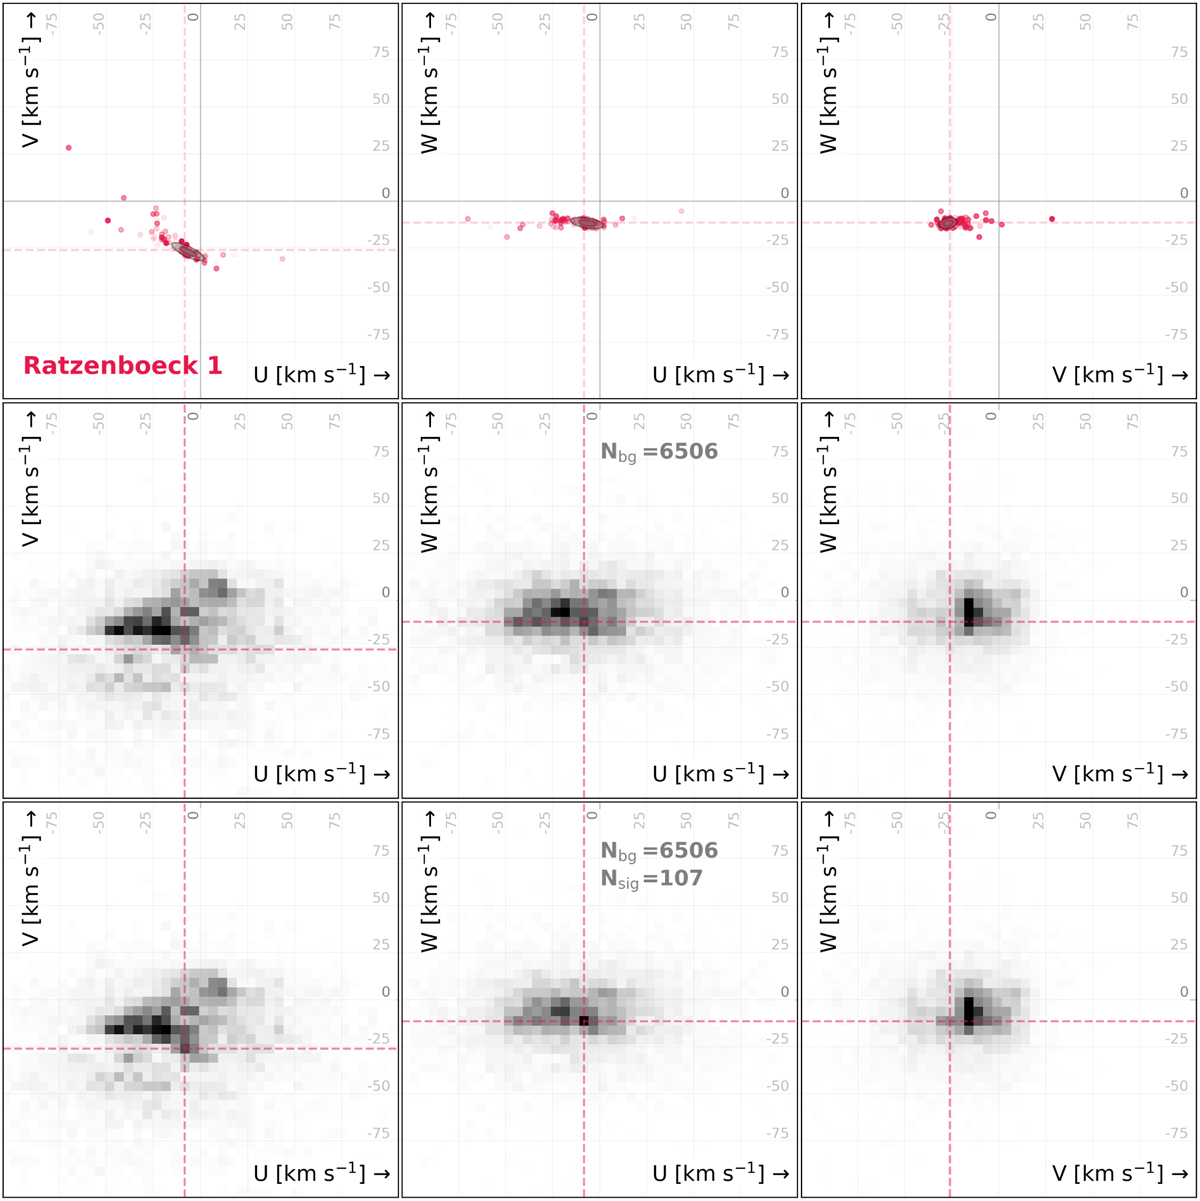
Fig. E.5
Download original image
S/N estimation procedure applied to the Ratzenboeck 1 stream. The 3D histogram in the middle and bottom row is shown as three marginalized 2D histograms, showing U-V, U-W, and V-W combinations of the disk stream Ratzenboeck 1 and its respective background population. The top row displays the individual stream members in red (akin to Fig. E.2). The middle and bottom rows show the distribution of background sources and the combined sample of signal and background, respectively. The color map represents the number density. Dark regions symbolize high and light gray regions low number densities. Each histogram is normalized and integrates to unity. The horizontal and vertical dashed line indicates the bulk (i.e., the median) velocity of the disk stream. The voxel, which contains most of the disk stream, has a significant number density increase when adding the identified stream candidate members, as shown in the bottom row. The 3D histogram plots showing the other 11 disk streams are provided online via Zenodo, using the following link.
Current usage metrics show cumulative count of Article Views (full-text article views including HTML views, PDF and ePub downloads, according to the available data) and Abstracts Views on Vision4Press platform.
Data correspond to usage on the plateform after 2015. The current usage metrics is available 48-96 hours after online publication and is updated daily on week days.
Initial download of the metrics may take a while.