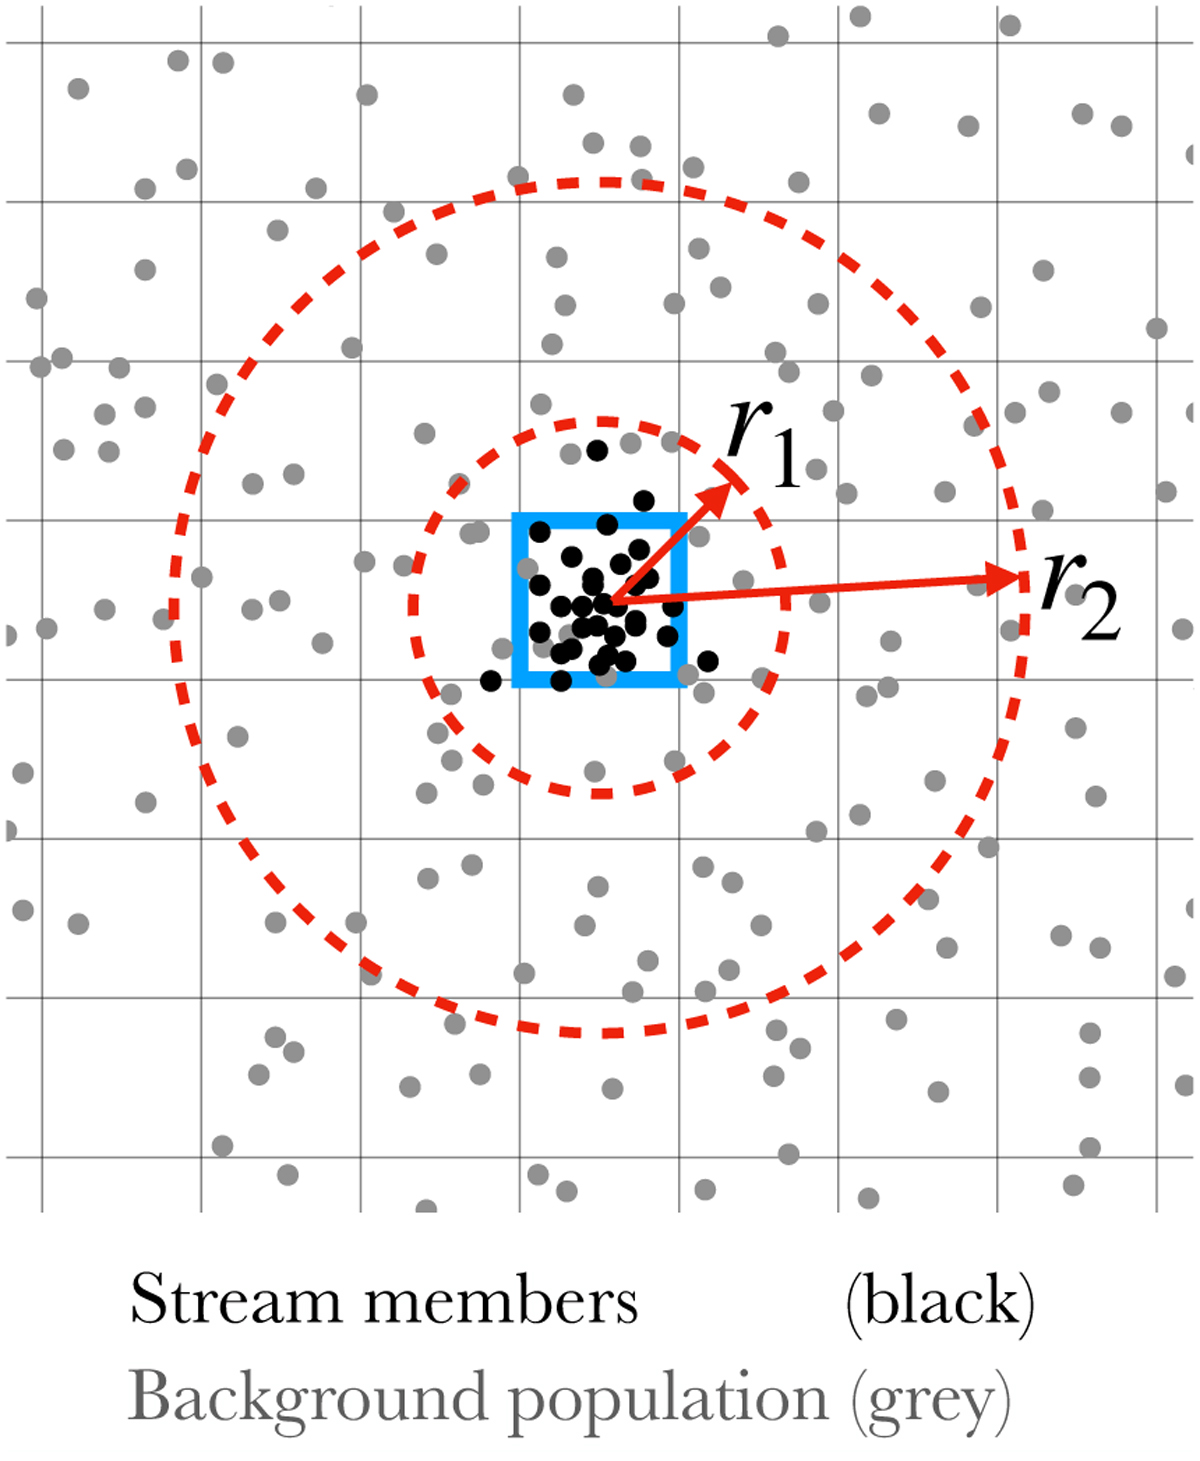
Fig. E.1
Download original image
Schematic representation of the procedure used to estimate contamination in velocity space. The figure highlights the central voxel (blue) centered on the bulk velocity of stream members, where their density (black dots) is maximal. Background sources (gray points) are distributed more broadly across velocity space. This spatial separation in UVW velocity space enables the estimation of the expected background density at the stream signal location, which is used to calculate each stream’s S/N. The red concentric circles illustrate the neighborhoods across which the expected background number density is estimated.
Current usage metrics show cumulative count of Article Views (full-text article views including HTML views, PDF and ePub downloads, according to the available data) and Abstracts Views on Vision4Press platform.
Data correspond to usage on the plateform after 2015. The current usage metrics is available 48-96 hours after online publication and is updated daily on week days.
Initial download of the metrics may take a while.