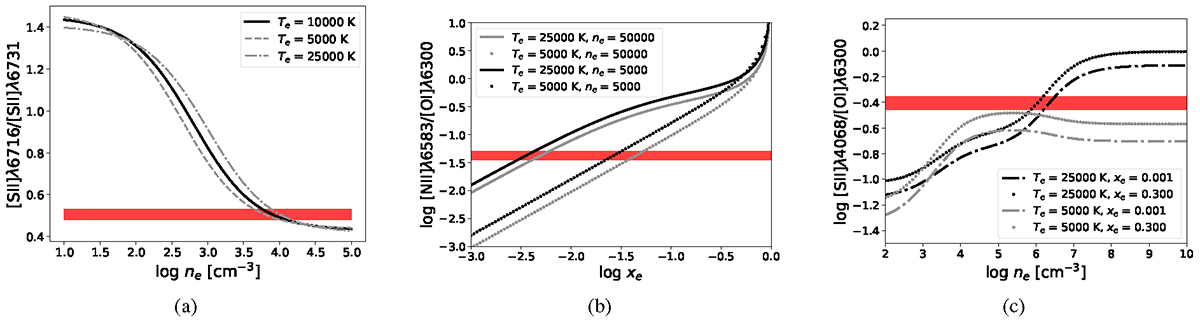
Fig. 9.
Download original image
Diagnostic diagrams for the observed line fluxes of Par Lup 3−4. The red horizontal stripes indicate the measured line flux ratios including their 1σ error margins. The black and grey curves are theoretical line ratios derived from our underlying excitation model. They represent reproductions of Fig. A.2. in Giannini et al. (2019).
Current usage metrics show cumulative count of Article Views (full-text article views including HTML views, PDF and ePub downloads, according to the available data) and Abstracts Views on Vision4Press platform.
Data correspond to usage on the plateform after 2015. The current usage metrics is available 48-96 hours after online publication and is updated daily on week days.
Initial download of the metrics may take a while.