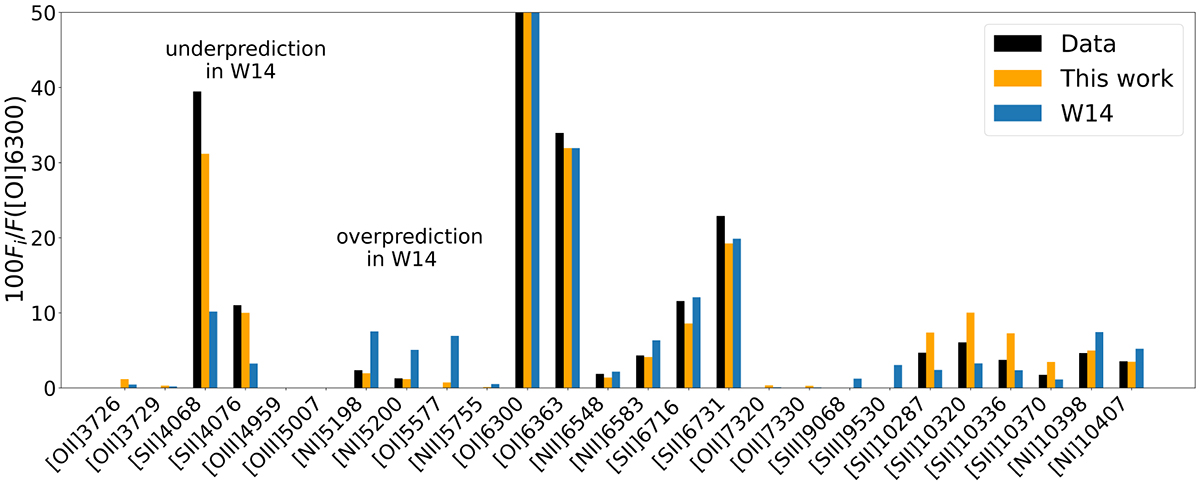
Fig. 10.
Download original image
A comparison of the observed emission line ratios (black bars) with the best model (yellow bars) found by the multi-line analysis and the W14 model found via the classical BE99 method (blue bars). [O I]λ6300 is reproduced by both models, the plot therefore zooms in on the weaker lines. We see an overall agreement of the observed data with the two models – especially with the optical BE99 lines. The [O I]λ5577, [N I]λ5198, and [N I]λ5200 emission lines, however, are substantially overpredicted and the [S II]λ4068 and[S II]λ4076 lines are heavily underpredicted in W14. The near-infrared lines of sulphur and nitrogen are well reproduced.
Current usage metrics show cumulative count of Article Views (full-text article views including HTML views, PDF and ePub downloads, according to the available data) and Abstracts Views on Vision4Press platform.
Data correspond to usage on the plateform after 2015. The current usage metrics is available 48-96 hours after online publication and is updated daily on week days.
Initial download of the metrics may take a while.