Fig. 9
Download original image
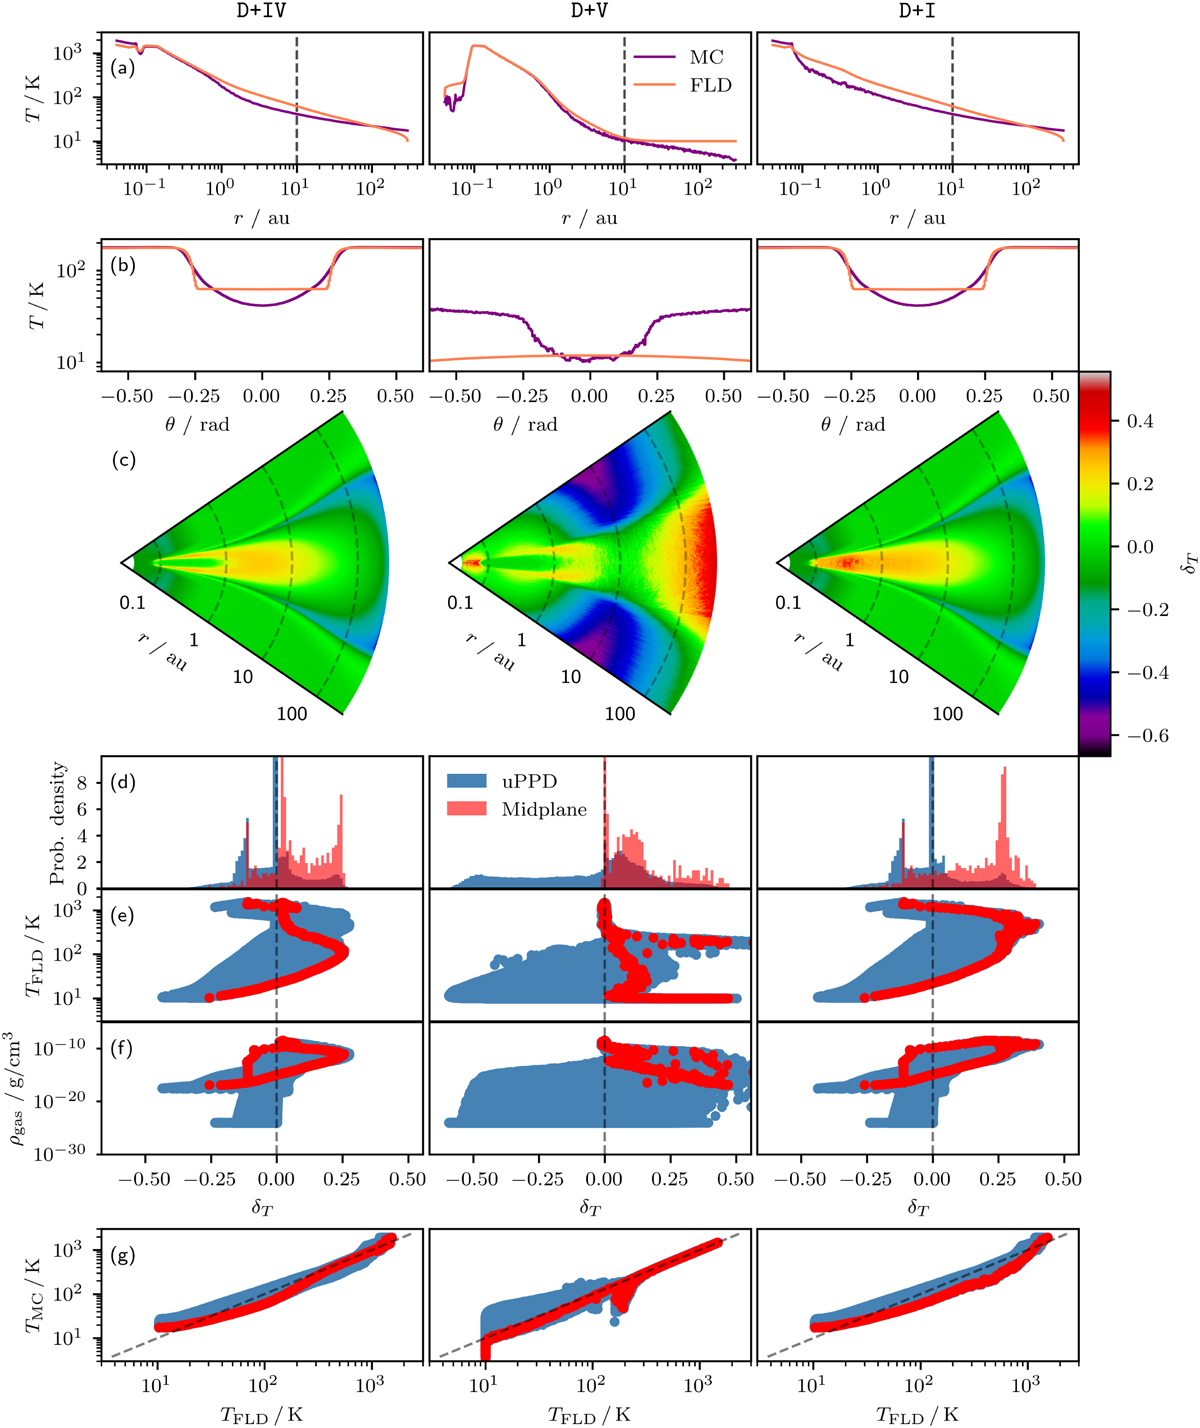
Temperature comparison overview for three axisymmetric uPPD models. The model is denoted at the top of each column. Different rows highlight different aspects of the comparisons between the FLD and MCRT temperatures. Row labels (a − g) at the top left of each row indicate the following: (a) Radial temperature profiles of the midplane, (b) polar temperature profiles at r = 10 au, (c) relative differences in a vertical cut through the midplane, (d) histogram of relative temperature differences, (e) scatter plot of FLD gas temperatures and relative temperature differences, (f) scatter plot of gas densities and relative temperature differences, and (g) scatter plot of MCRT and FLD temperatures.
Current usage metrics show cumulative count of Article Views (full-text article views including HTML views, PDF and ePub downloads, according to the available data) and Abstracts Views on Vision4Press platform.
Data correspond to usage on the plateform after 2015. The current usage metrics is available 48-96 hours after online publication and is updated daily on week days.
Initial download of the metrics may take a while.