Fig. 8
Download original image
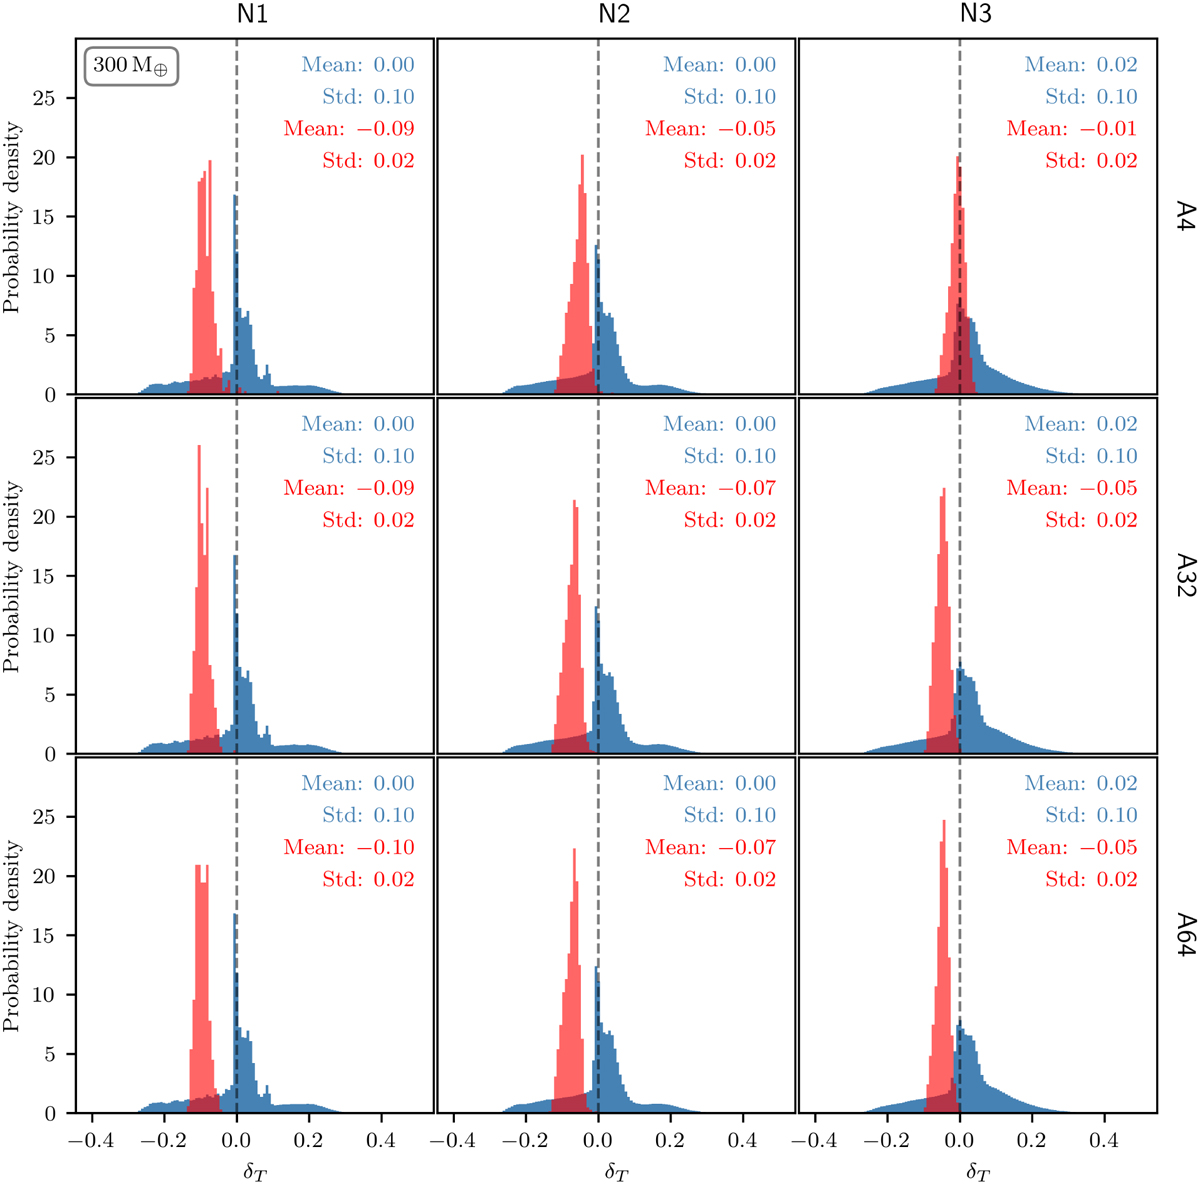
Overview of normalized histograms illustrating relative temperature differences for the 300 M⊕ models, as in the upper plot of Fig. 5. Here, each column represents data for a different model resolution (N1, N2, and N3 from left to right), while different rows present data for different accretion parameters (A4, A32, and A64 from top to bottom). For the purpose of better comparability, histograms have been clipped at a probability density value of 30.
Current usage metrics show cumulative count of Article Views (full-text article views including HTML views, PDF and ePub downloads, according to the available data) and Abstracts Views on Vision4Press platform.
Data correspond to usage on the plateform after 2015. The current usage metrics is available 48-96 hours after online publication and is updated daily on week days.
Initial download of the metrics may take a while.