Fig. 4
Download original image
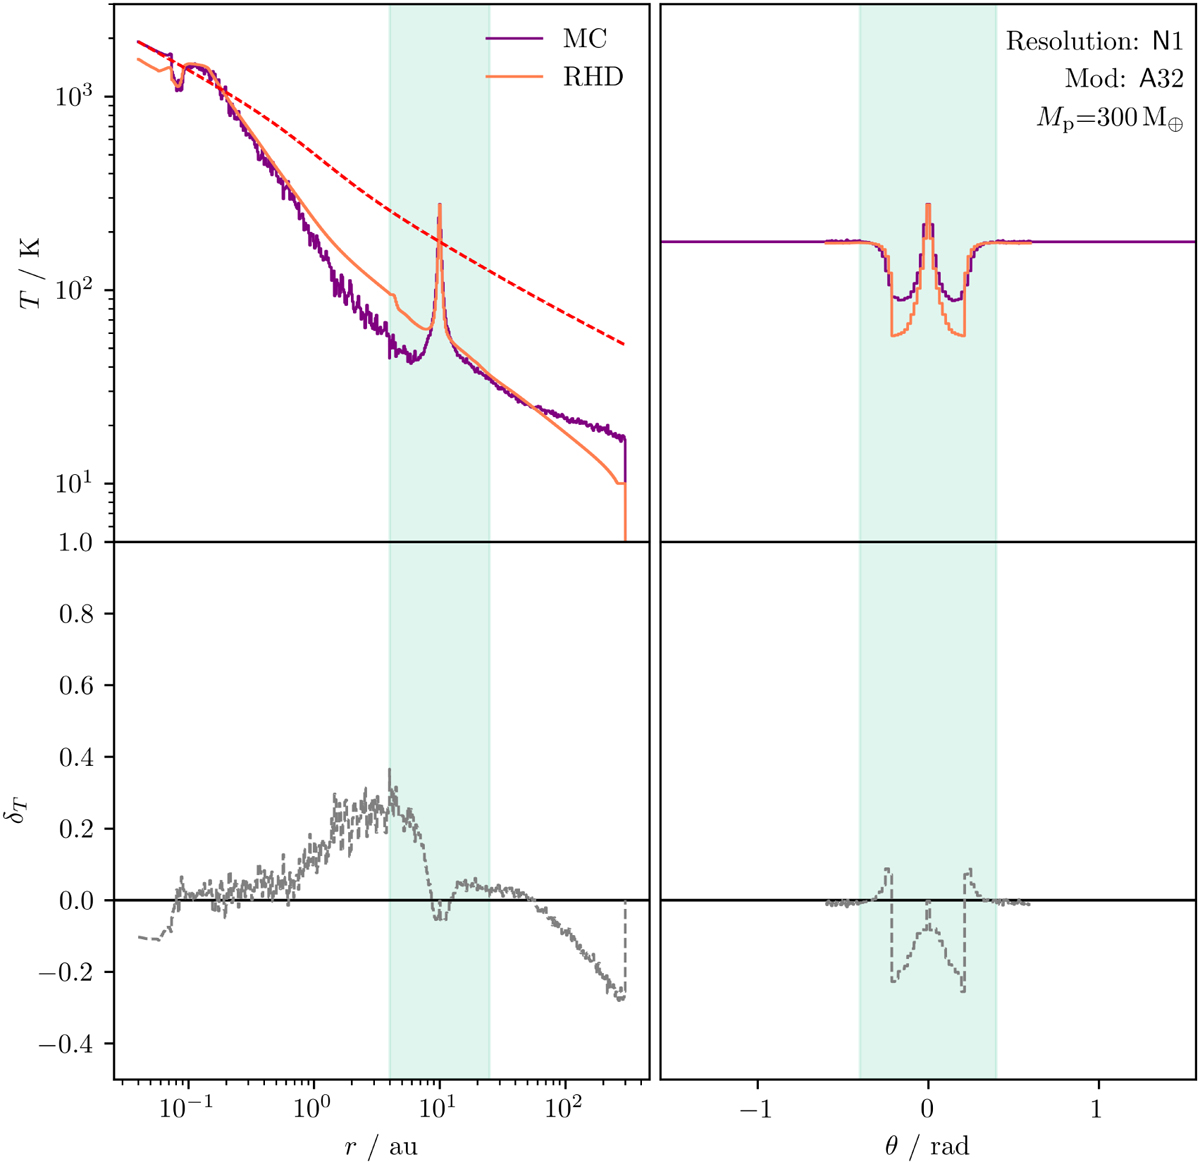
Comparison of temperature profiles (upper row) determined using the MCRT (purple lines) and RHD (orange lines) simulations and their relative differences (lower row, gray lines). Left: radial temperature profiles of the midplane in the azimuthal direction of the planet. Right: polar temperature profiles of the planetary region. Green colored regions mark the spatial domain covered by the 3D high-resolution RHD model. Model details are shown in the upper right.
Current usage metrics show cumulative count of Article Views (full-text article views including HTML views, PDF and ePub downloads, according to the available data) and Abstracts Views on Vision4Press platform.
Data correspond to usage on the plateform after 2015. The current usage metrics is available 48-96 hours after online publication and is updated daily on week days.
Initial download of the metrics may take a while.