Fig. 3
Download original image
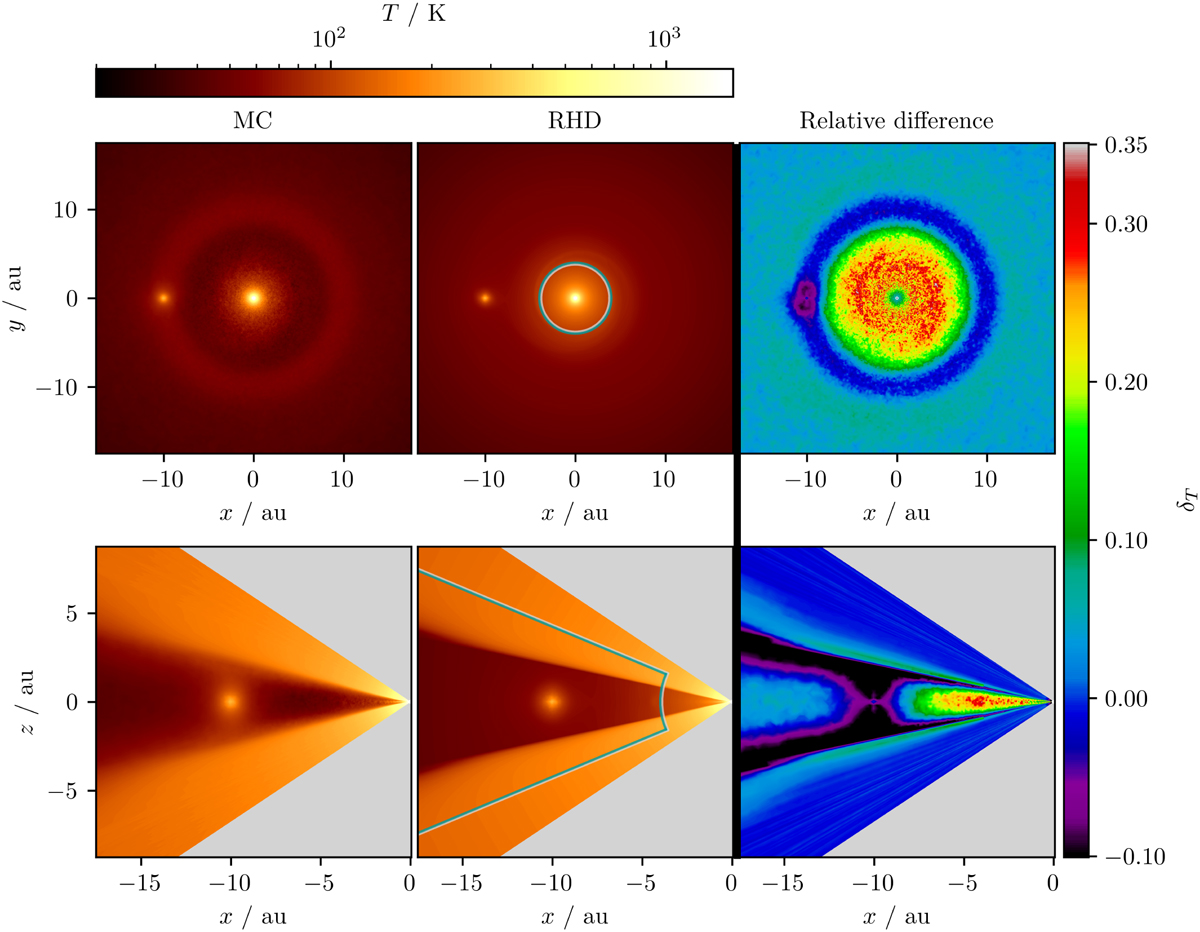
Cuts through the temperature distributions derived by the MCRT (left column) and RHD simulations (central column) and their relative differences δT (right column). The upper and lower rows show results for the midplane and a vertical cut through it at the azimuthal position of the planet, respectively. The color bar for the temperature distributions (relative differences) is displayed above (to the right). Additionally, the high-resolution and the low-resolution regions are divided by a green-gray line that is shown in the plots of the RHD simulations (i.e., in the central column). Here, the high-resolution (low-resolution) region is located on the green (gray) side of the line.
Current usage metrics show cumulative count of Article Views (full-text article views including HTML views, PDF and ePub downloads, according to the available data) and Abstracts Views on Vision4Press platform.
Data correspond to usage on the plateform after 2015. The current usage metrics is available 48-96 hours after online publication and is updated daily on week days.
Initial download of the metrics may take a while.