Fig. 11
Download original image
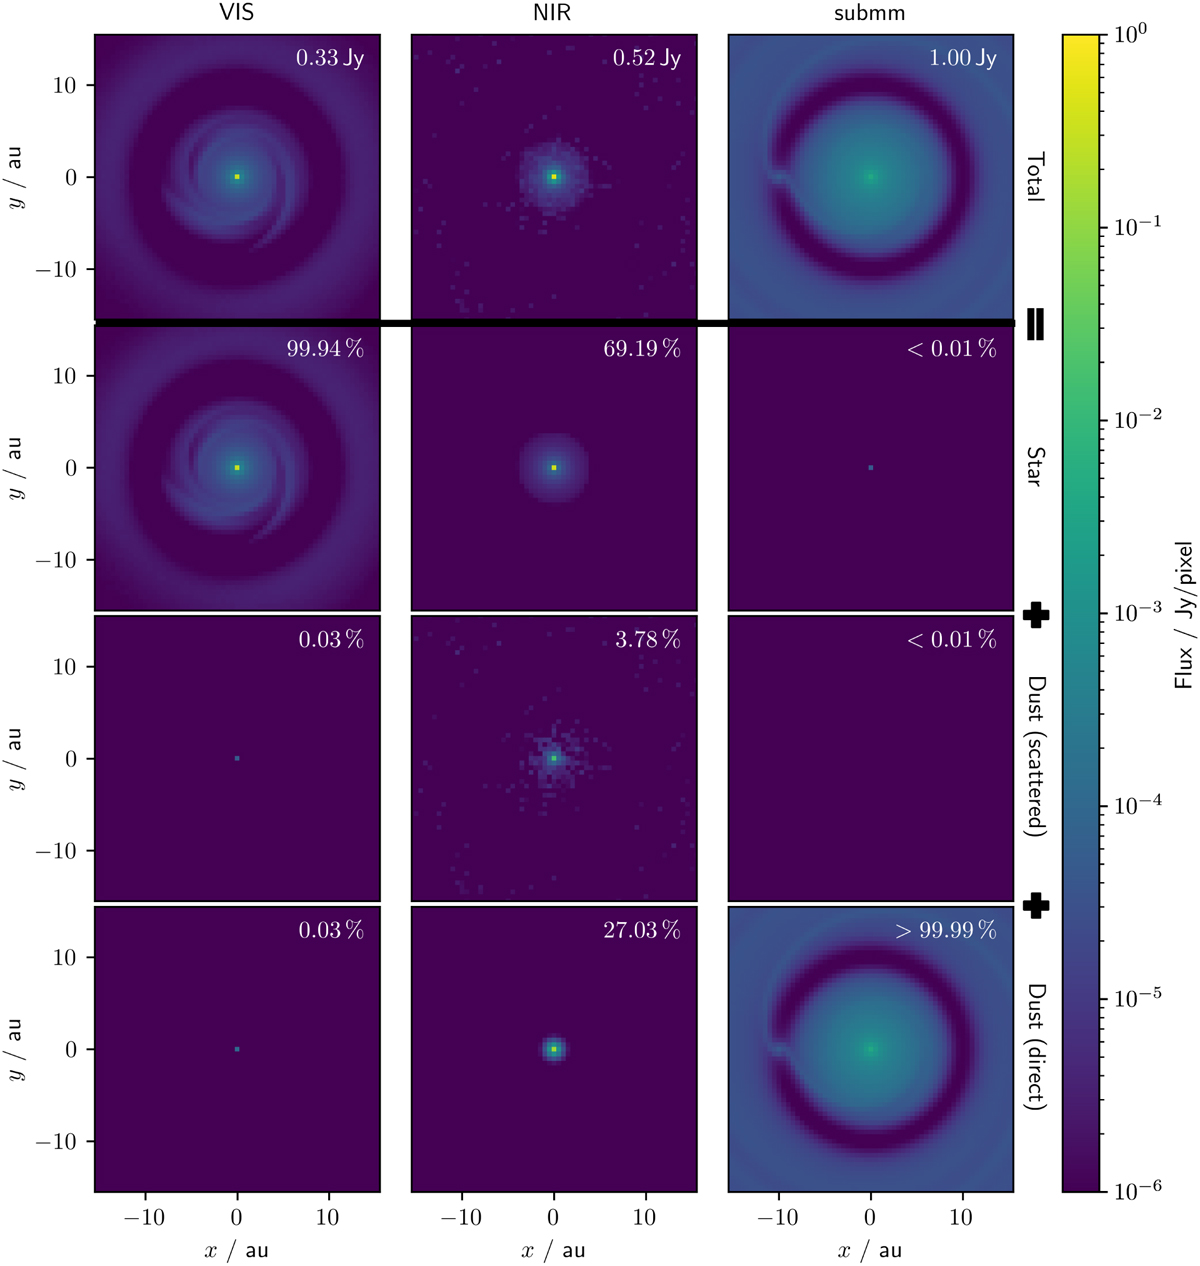
Total flux maps (first row from the top) at three different wavelengths, the VIS (left column), NIR (central column), and submm (right column) range, for the reference model based on the temperature distribution TMC. The total flux maps were calculated as the sum of three individual flux maps corresponding to the contributions of the star (second row), self-scattered thermal dust emission (third row), and direct unscattered thermal dust emission (fourth row). Respective labels of the individual maps and their interrelationship are indicated at the right of each row. The total flux of each model, given in Jansky, is indicated in the upper-right corner of each total flux map. Percentage values in the upper-right corner of the flux maps below (rows 2, 3, and 4), denote the contribution of the respective radiation source to the total flux of the model.
Current usage metrics show cumulative count of Article Views (full-text article views including HTML views, PDF and ePub downloads, according to the available data) and Abstracts Views on Vision4Press platform.
Data correspond to usage on the plateform after 2015. The current usage metrics is available 48-96 hours after online publication and is updated daily on week days.
Initial download of the metrics may take a while.