Fig. 10
Download original image
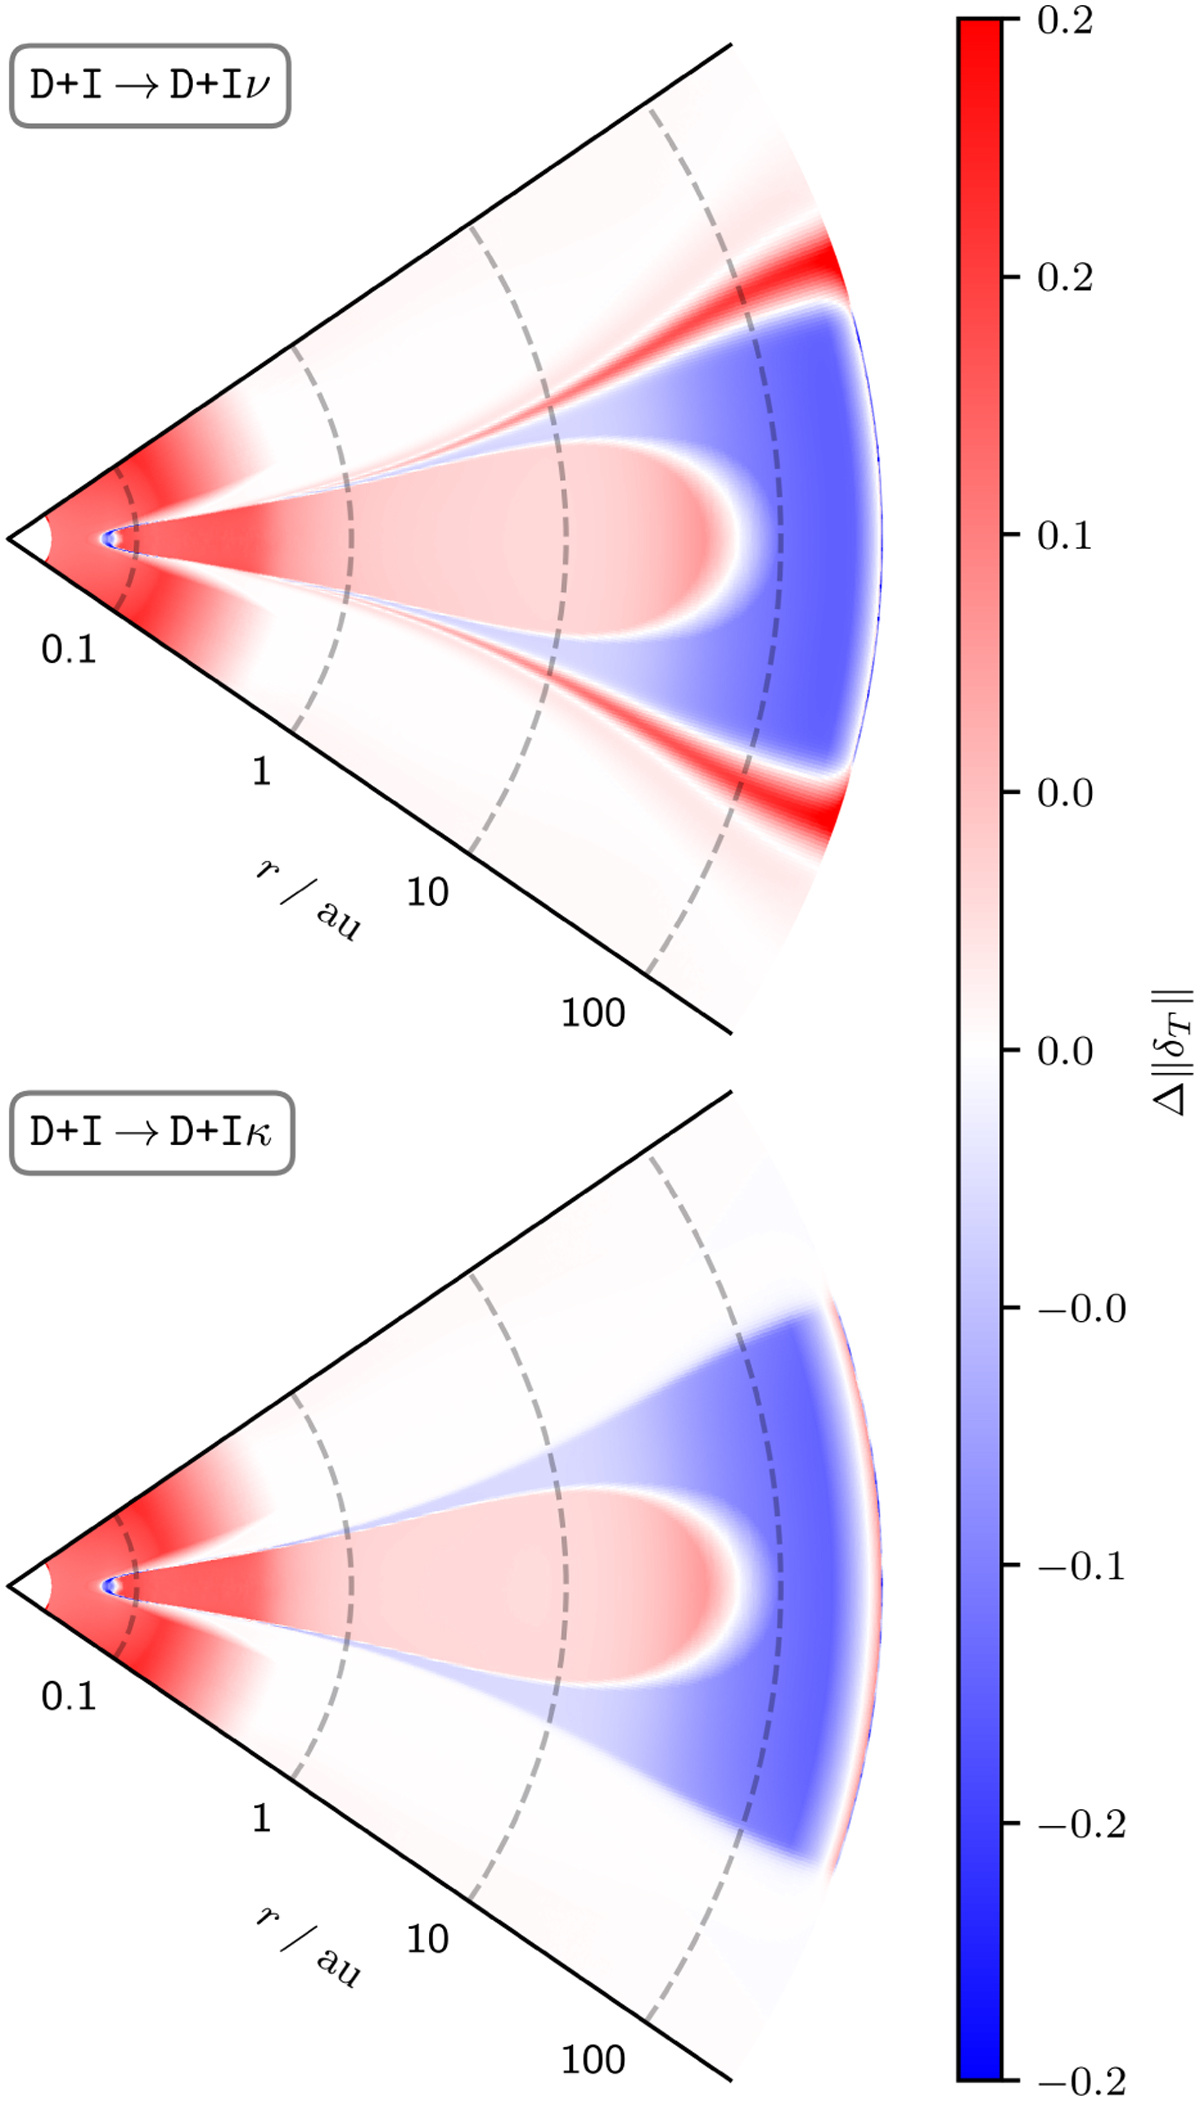
Change of similarity, Δ‖δT‖, in a vertical cut through the midplane of the uPPD. The upper (lower) plot shows the results for switching from model D+I to model D+Iv (D+Iκ). In regions where Δ‖δT‖ is positive (negative), the change led to an increased (decreased) agreement between FLD and MCRT temperatures. (For details, see Sect. 3.2.2.)
Current usage metrics show cumulative count of Article Views (full-text article views including HTML views, PDF and ePub downloads, according to the available data) and Abstracts Views on Vision4Press platform.
Data correspond to usage on the plateform after 2015. The current usage metrics is available 48-96 hours after online publication and is updated daily on week days.
Initial download of the metrics may take a while.