Fig. 1
Download original image
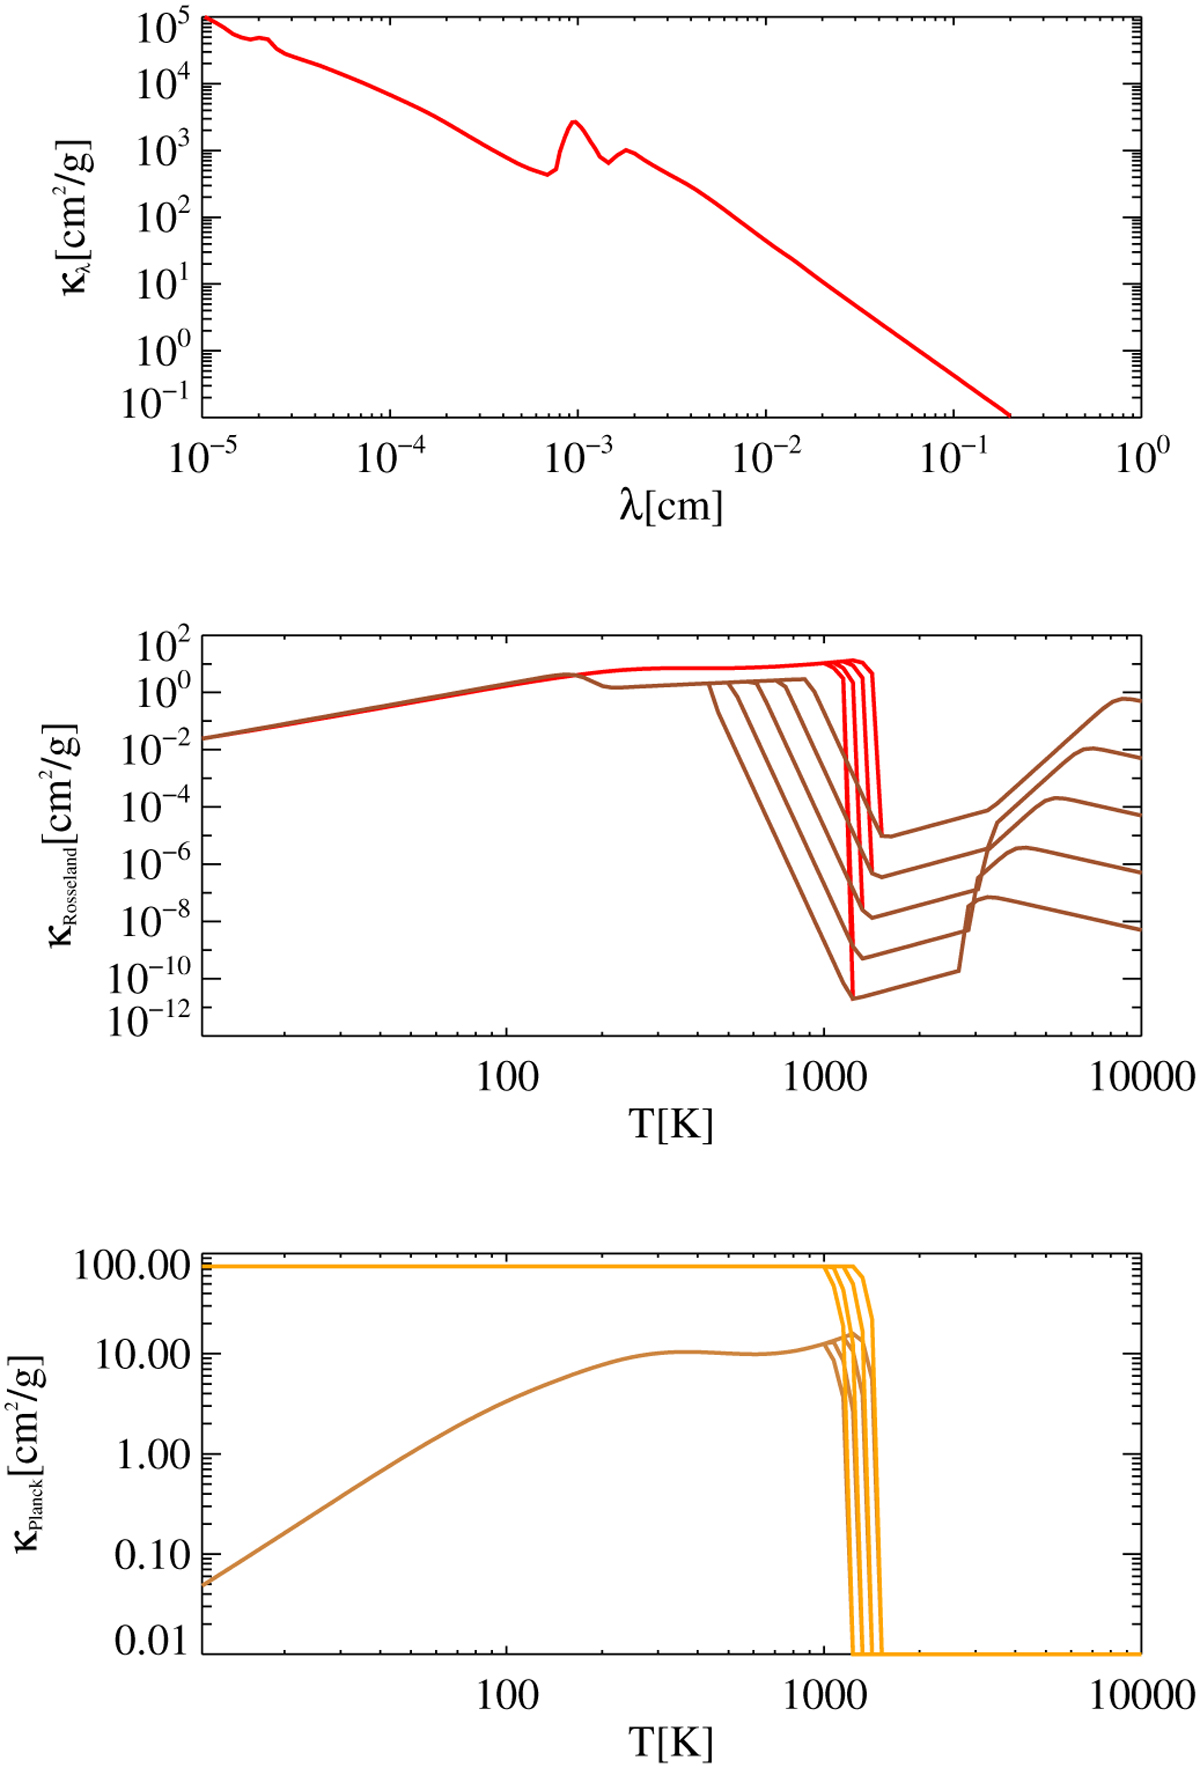
Wavelength and temperature dependence of the opacity. Upper plot: Dust opacity as a function of wavelength. Middle plot: Rosseland mean opacity exemplarily for five gas densities (10–18, 10–16, 10–14, 10–12, and 10–10 g/cm3) in ascending order in the plot (red = this paper; brown = Bell & Lin 1994). Lower plot: Planck opacities for the same gas densities, likewise in ascending order in the plot (red: Trad = Tgas; orange: Trad = Tstar). Mean opacities consider the evaporation of silicates following Isella & Natta (2005). But for consistency with the MCRT, ice evaporation is not considered in the opacities.
Current usage metrics show cumulative count of Article Views (full-text article views including HTML views, PDF and ePub downloads, according to the available data) and Abstracts Views on Vision4Press platform.
Data correspond to usage on the plateform after 2015. The current usage metrics is available 48-96 hours after online publication and is updated daily on week days.
Initial download of the metrics may take a while.