Fig. 2
Download original image
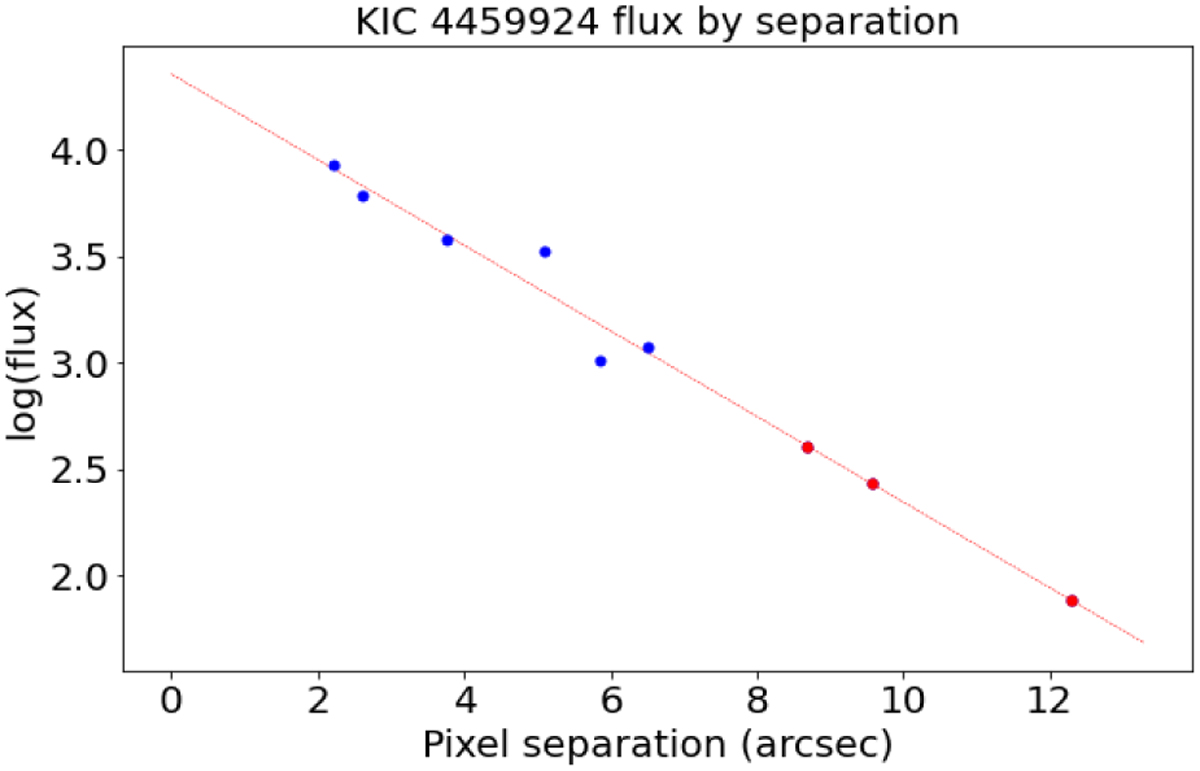
Quarter 14 main-target average flux per pixel as a function of the separation (distance) of the pixel centre location from the main target location in arcsec (blue circles). The red line is the fit to log(flux), and the red circles indicate the extrapolation of the fitted line to the locations of the exoplanet candidate pixels.
Current usage metrics show cumulative count of Article Views (full-text article views including HTML views, PDF and ePub downloads, according to the available data) and Abstracts Views on Vision4Press platform.
Data correspond to usage on the plateform after 2015. The current usage metrics is available 48-96 hours after online publication and is updated daily on week days.
Initial download of the metrics may take a while.