Open Access
Fig. 12
Download original image
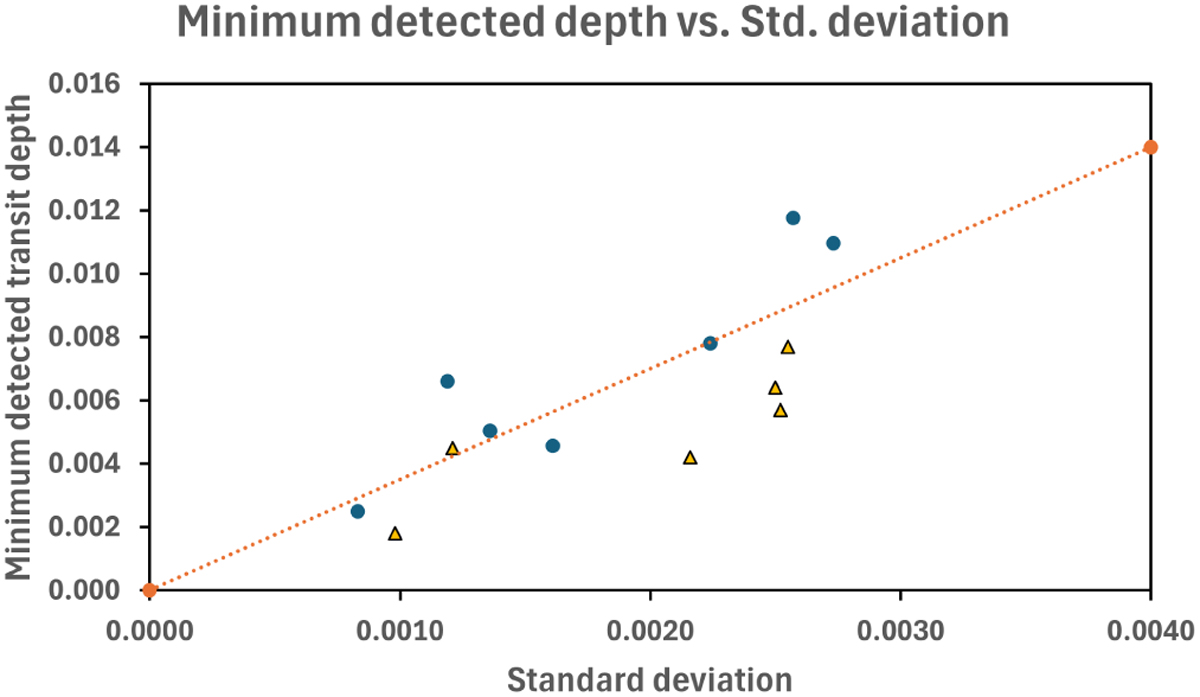
Minimum detectable fractional transit depth for the exoplanet candidates as a function of the standard deviation, σ, of the normalised pixel light curves (blue circles) and the normalised Q2–Q16 light curves (orange triangles). The red line is the expected lower limit of 3.5σ.
Current usage metrics show cumulative count of Article Views (full-text article views including HTML views, PDF and ePub downloads, according to the available data) and Abstracts Views on Vision4Press platform.
Data correspond to usage on the plateform after 2015. The current usage metrics is available 48-96 hours after online publication and is updated daily on week days.
Initial download of the metrics may take a while.