Fig. 5
Download original image
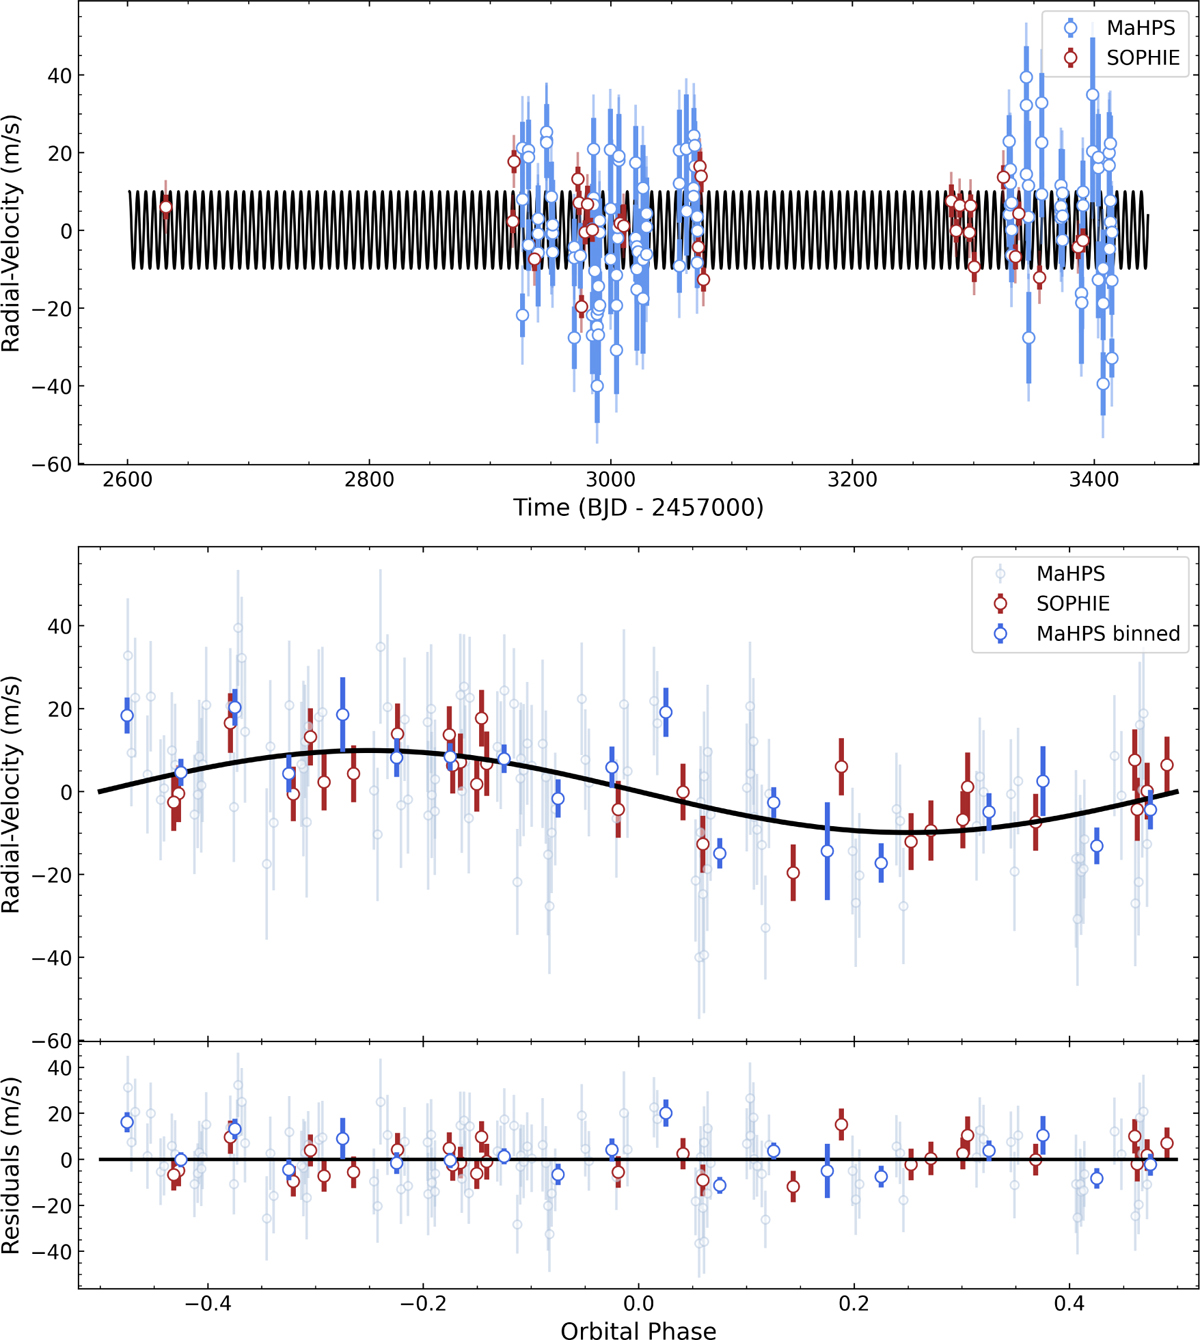
Result of the juliet fit of TOI-5108. Upper panel: radial velocity curve of TOI-5108 with the best fit Keplerian model for TOI-5108 b in black. Middle panel: phase-folded radial velocity curve. The dark blue data points represent the MaHPS RV data binned at 0.05 phases. Light blue is the unbinned MaHPS data and red is the SOPHIE data. Lower Panel: Residuals after subtracting the signal of TOI-5108 b.
Current usage metrics show cumulative count of Article Views (full-text article views including HTML views, PDF and ePub downloads, according to the available data) and Abstracts Views on Vision4Press platform.
Data correspond to usage on the plateform after 2015. The current usage metrics is available 48-96 hours after online publication and is updated daily on week days.
Initial download of the metrics may take a while.