Fig. 3
Download original image
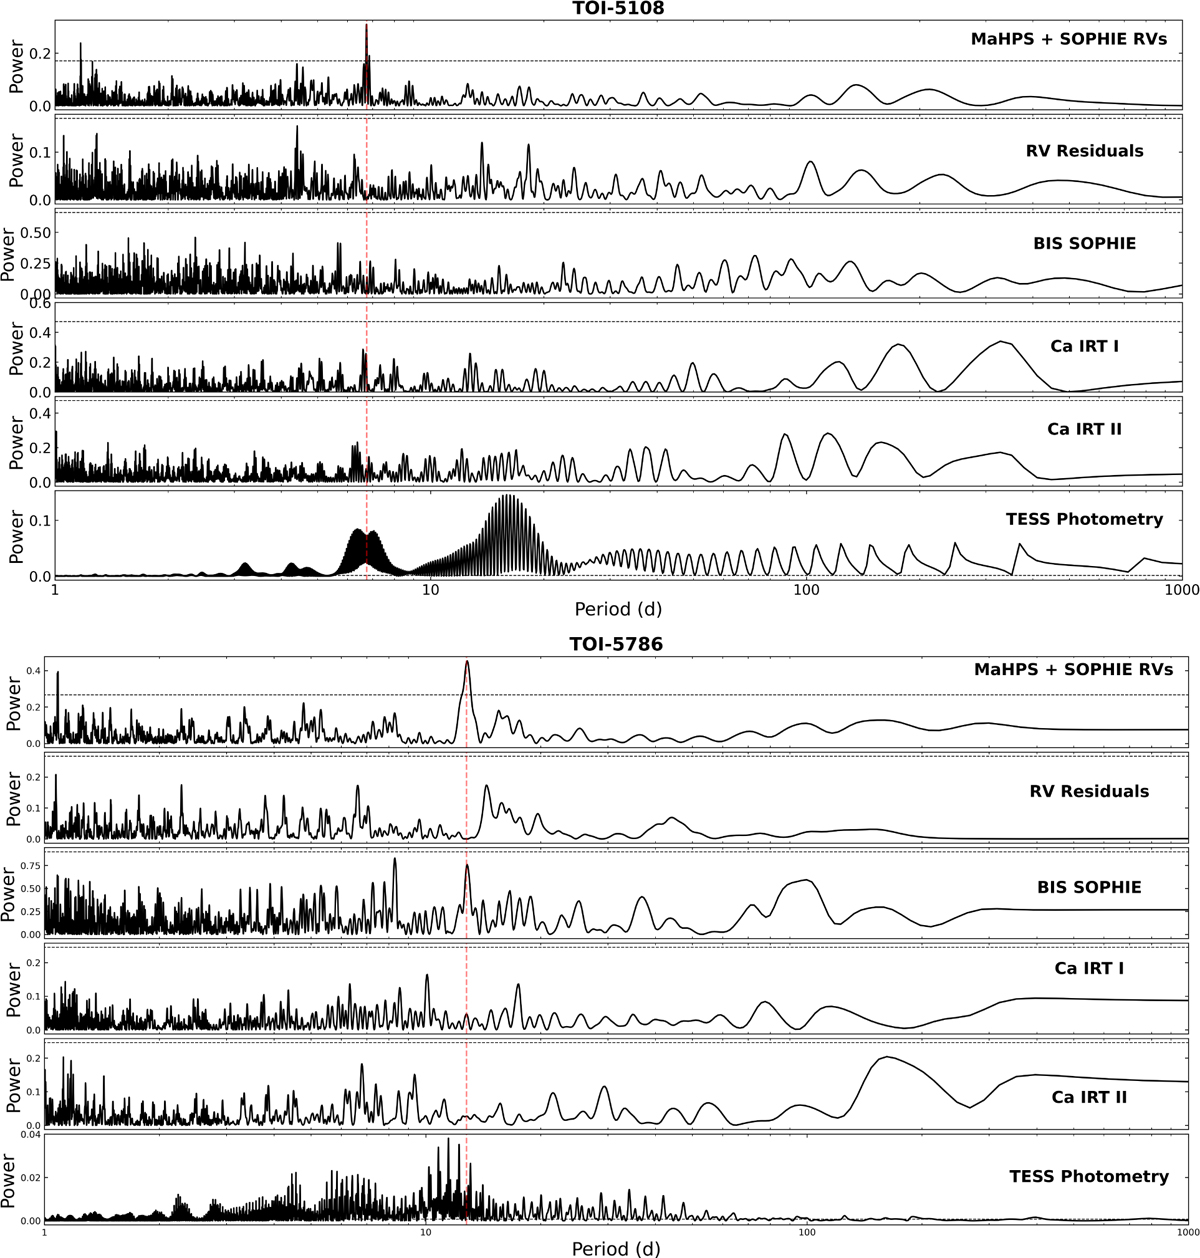
GLS periodograms of TOI-5108 and TOI-5786. The top periodograms belong to TOI-5108. The first and second rows are the RV data from MaHPS and SOPHIE before and after subtracting the signal of the transiting planet. The next three rows show the periodograms of the activity indicators derived from the SOPHIE spectra (BIS) and MaHPS spectra (Ca IRT). The last row shows the periodogram of the TESS data. The dotted red line shows the period of the transiting planet and the dotted black line is located at the 0.1% FAP. Bottom periodograms are the same as the top ones but for TOI-5786.
Current usage metrics show cumulative count of Article Views (full-text article views including HTML views, PDF and ePub downloads, according to the available data) and Abstracts Views on Vision4Press platform.
Data correspond to usage on the plateform after 2015. The current usage metrics is available 48-96 hours after online publication and is updated daily on week days.
Initial download of the metrics may take a while.