Fig. D.1
Download original image
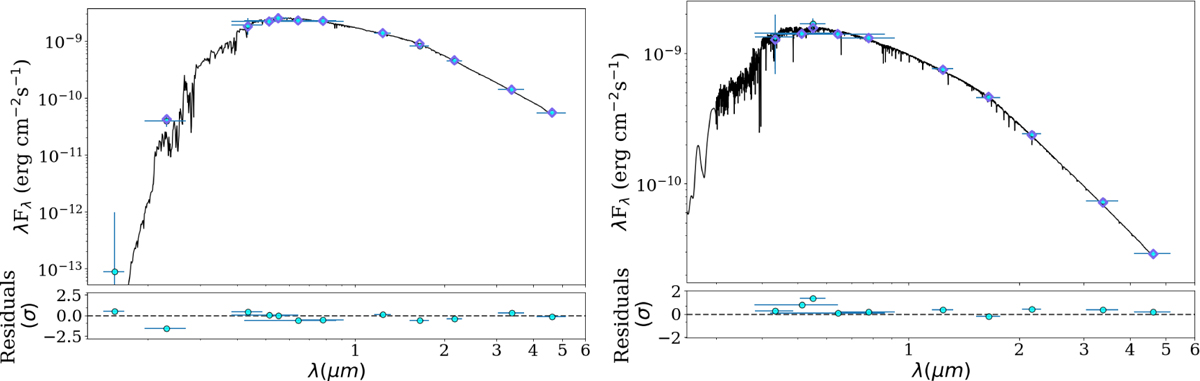
SED fits for TOI-5108 (left) and TOI-5786 (right). Blue points represent the flux values from available broadband photometry and the purple diamonds indicate the flux value of the synthetic photometry in the same passband. The best-fitting model is plotted in black. Residuals normalized to the errors of the photometry are shown below.
Current usage metrics show cumulative count of Article Views (full-text article views including HTML views, PDF and ePub downloads, according to the available data) and Abstracts Views on Vision4Press platform.
Data correspond to usage on the plateform after 2015. The current usage metrics is available 48-96 hours after online publication and is updated daily on week days.
Initial download of the metrics may take a while.