Fig. 8
Download original image
![]() versus
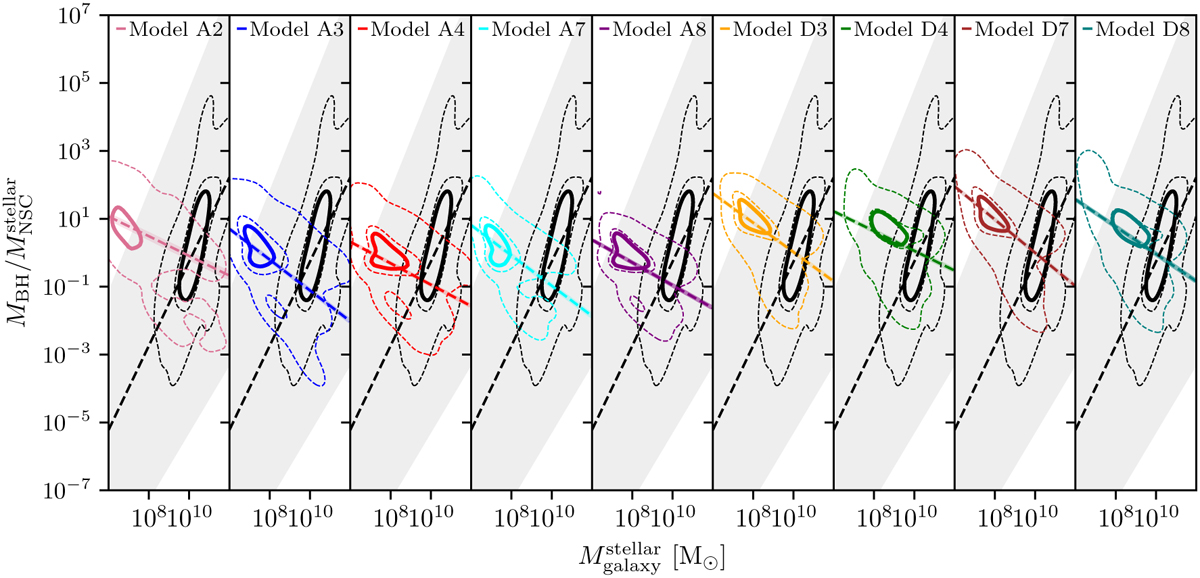
versus ![]() . The 2D PDF is shown as contour lines; the thick solid line marks the 1σ of the 2D PDFs. The best fit of the data is represented by dashed lines. From left to right, the contours indicate model A2 (light rose), A3 (blue), A4 (red), A7 (cyan), A8 (purple), D3 (orange), D4 (green), D7 (brown), and D8 (teal), while black lines correspond to the observational sample. The filled light areas correspond to the 1σ error of the fit slope and intercept.
. The 2D PDF is shown as contour lines; the thick solid line marks the 1σ of the 2D PDFs. The best fit of the data is represented by dashed lines. From left to right, the contours indicate model A2 (light rose), A3 (blue), A4 (red), A7 (cyan), A8 (purple), D3 (orange), D4 (green), D7 (brown), and D8 (teal), while black lines correspond to the observational sample. The filled light areas correspond to the 1σ error of the fit slope and intercept.
Current usage metrics show cumulative count of Article Views (full-text article views including HTML views, PDF and ePub downloads, according to the available data) and Abstracts Views on Vision4Press platform.
Data correspond to usage on the plateform after 2015. The current usage metrics is available 48-96 hours after online publication and is updated daily on week days.
Initial download of the metrics may take a while.