Fig. 7
Download original image
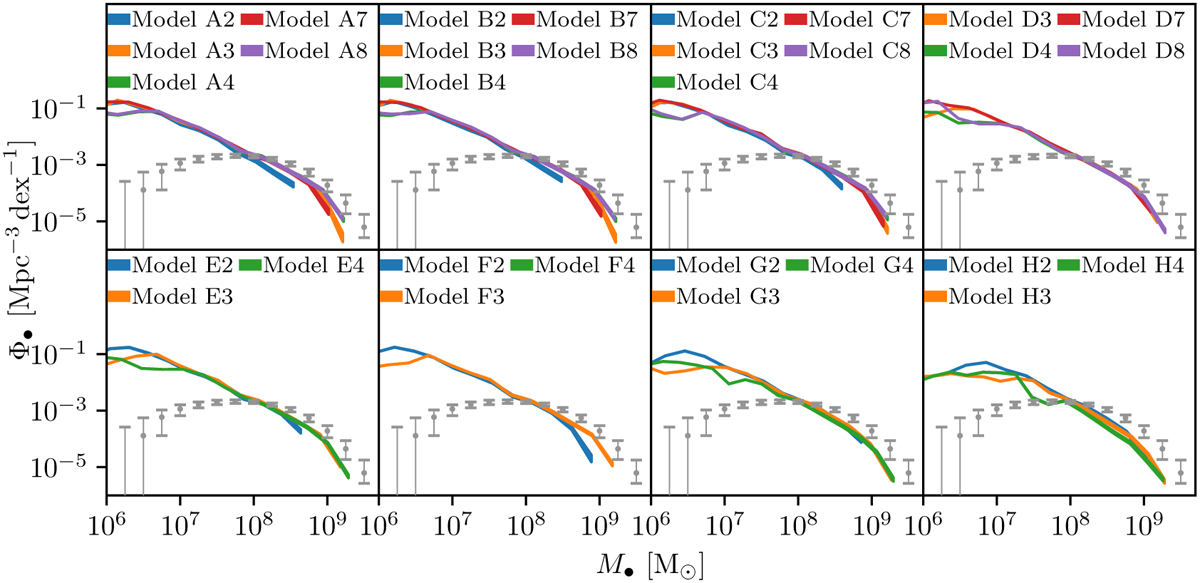
Comparison between the BHMF determined by Vika et al. (2009, gray dots) with our SAMs at ɀ = 0 for galaxies with stellar masses higher than 106 M⊙ that host NSCs with stellar masses above 103 M⊙. The gray dots include the ±1σ error bars, while the thickness of our lines denotes the ±1σ error for our SAMs, estimated as ![]() , where N is the number of SMBHs contained in the bin.
, where N is the number of SMBHs contained in the bin.
Current usage metrics show cumulative count of Article Views (full-text article views including HTML views, PDF and ePub downloads, according to the available data) and Abstracts Views on Vision4Press platform.
Data correspond to usage on the plateform after 2015. The current usage metrics is available 48-96 hours after online publication and is updated daily on week days.
Initial download of the metrics may take a while.