Fig. 1
Download original image
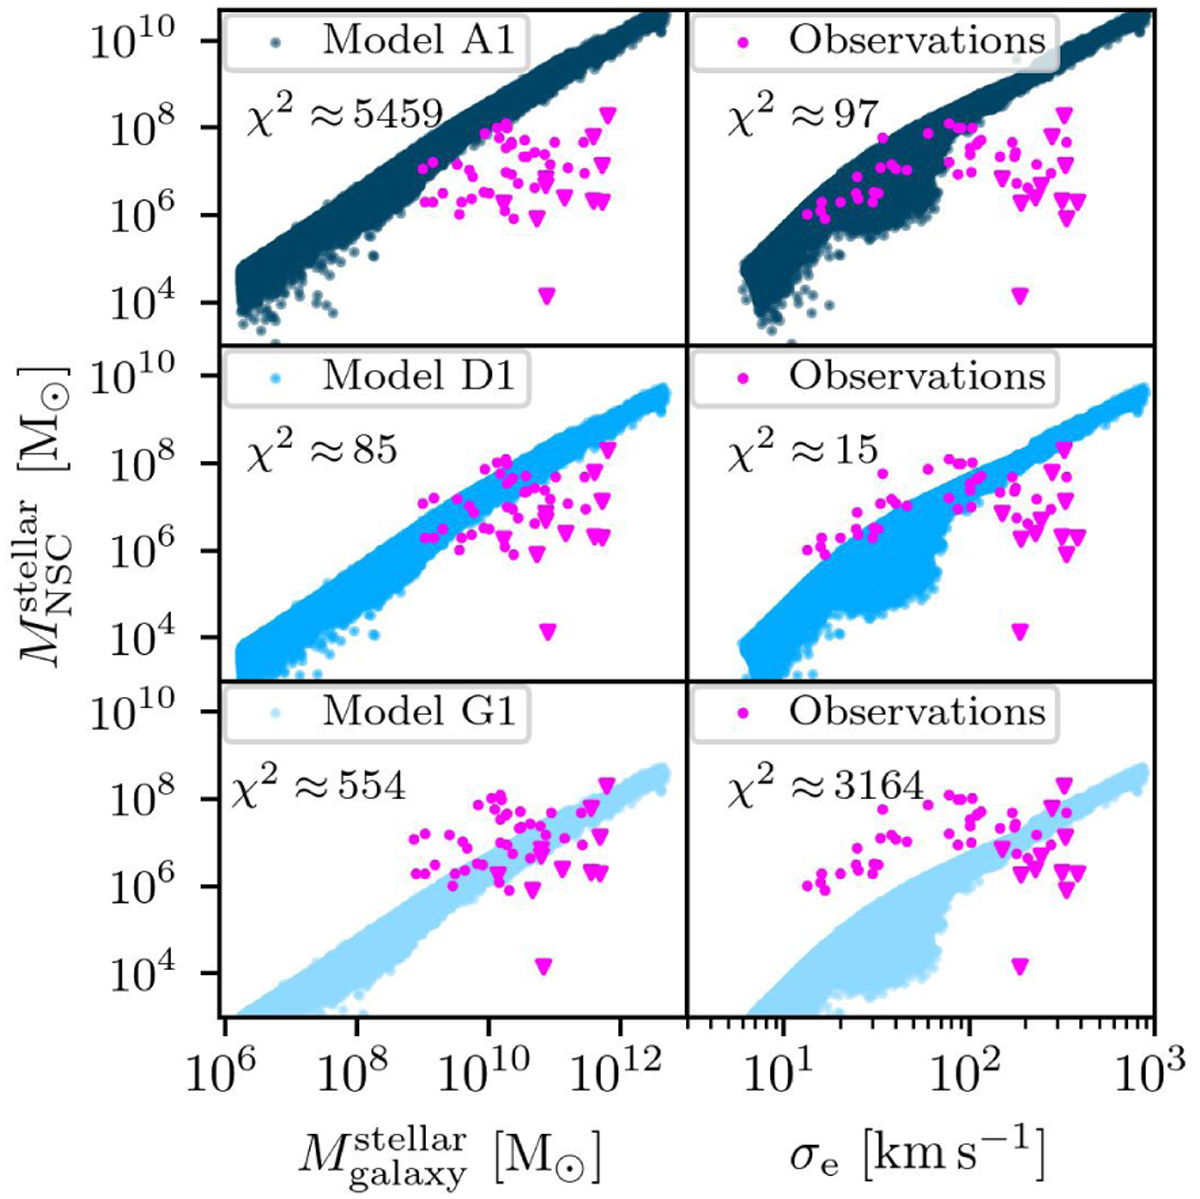
Stellar mass of the NSCs as a function of the stellar mass of the galaxy (left) and as a function of the stellar velocity dispersion of the galaxy (right) for models A1, D1, and G1. Magenta dots correspond to observed NSCs following Table 3 of Neumayer et al. (2020); we removed galaxies whose stellar mass is not included and included the stellar velocity dispersion available in the literature. Magenta dots correspond to galaxies where the stellar mass of the NSC is well determined, while magenta triangles represent an upper limit instead. The corresponding table is available in Appendix D. Each panel includes the chi-squared test value of the model for reference.
Current usage metrics show cumulative count of Article Views (full-text article views including HTML views, PDF and ePub downloads, according to the available data) and Abstracts Views on Vision4Press platform.
Data correspond to usage on the plateform after 2015. The current usage metrics is available 48-96 hours after online publication and is updated daily on week days.
Initial download of the metrics may take a while.