Fig. 4
Download original image
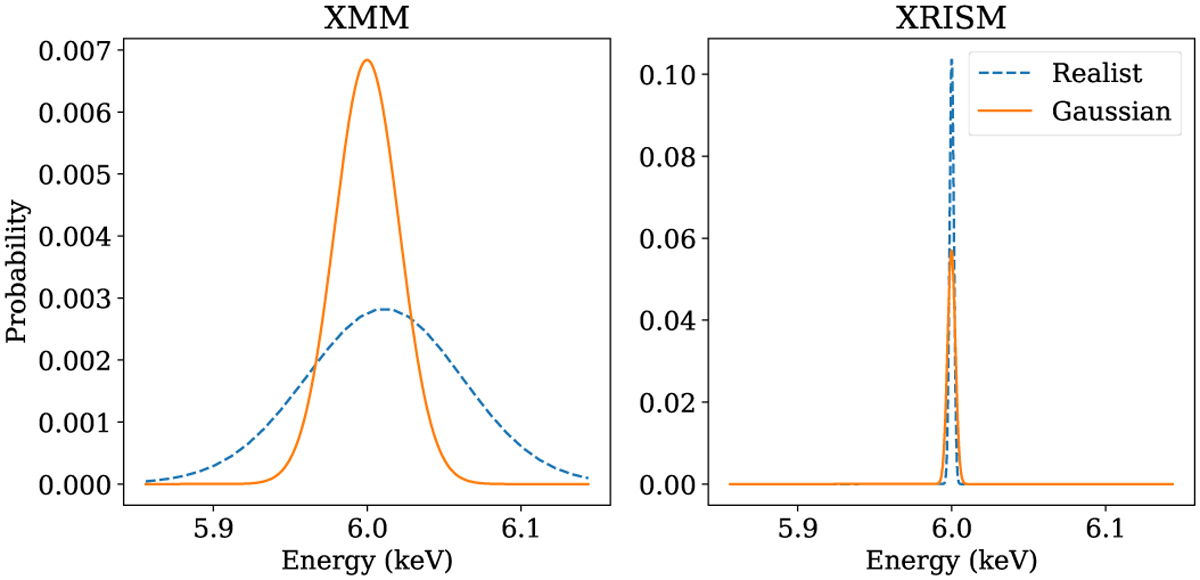
Comparison of the four spectral responses used to generate the toy models. The responses for the XMM-Newton-like instrument are shown on the right, while those for the XRISM-like are shown on the left. The full orange line is for the Gaussian approximations, and the dashed blue line is for the realistic instrument responses.
Current usage metrics show cumulative count of Article Views (full-text article views including HTML views, PDF and ePub downloads, according to the available data) and Abstracts Views on Vision4Press platform.
Data correspond to usage on the plateform after 2015. The current usage metrics is available 48-96 hours after online publication and is updated daily on week days.
Initial download of the metrics may take a while.