Fig. 8.
Download original image
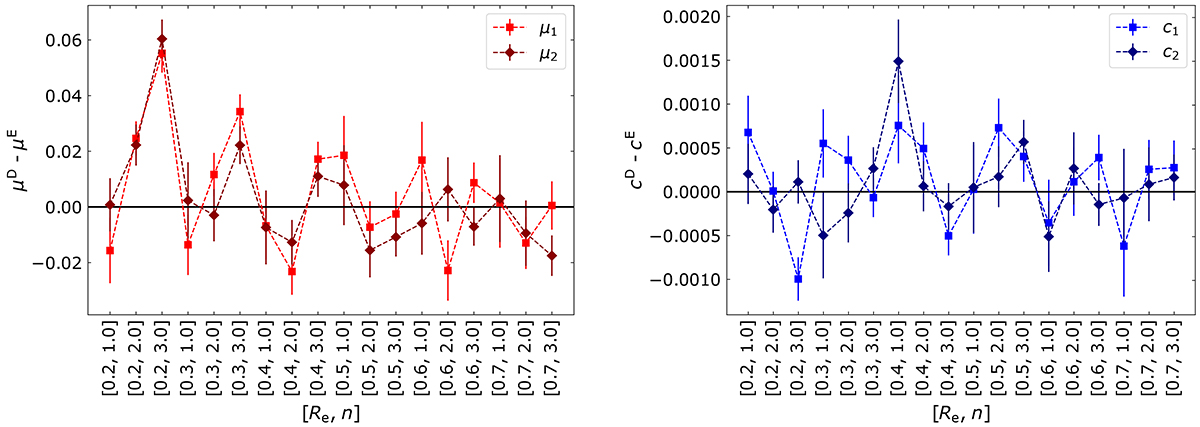
Multiplicative (left panel) and additive (right panel) shear bias differences as functions of effective radius (Re) and Sérsic index (n), using a Euclid/VIS pixel scale of 0![]() 1 and a lanczos15 interpolation kernel. The analysis accounts for noise correlations in S/N matching between the D and E images (test Ic), as detailed in Sect. 5.2. The data points show the bias obtained from the fit with the error bars indicating 1σ uncertainties for a number of galaxies Ngal for S/N ≃ 40.
1 and a lanczos15 interpolation kernel. The analysis accounts for noise correlations in S/N matching between the D and E images (test Ic), as detailed in Sect. 5.2. The data points show the bias obtained from the fit with the error bars indicating 1σ uncertainties for a number of galaxies Ngal for S/N ≃ 40.
Current usage metrics show cumulative count of Article Views (full-text article views including HTML views, PDF and ePub downloads, according to the available data) and Abstracts Views on Vision4Press platform.
Data correspond to usage on the plateform after 2015. The current usage metrics is available 48-96 hours after online publication and is updated daily on week days.
Initial download of the metrics may take a while.