Fig. 6.
Download original image
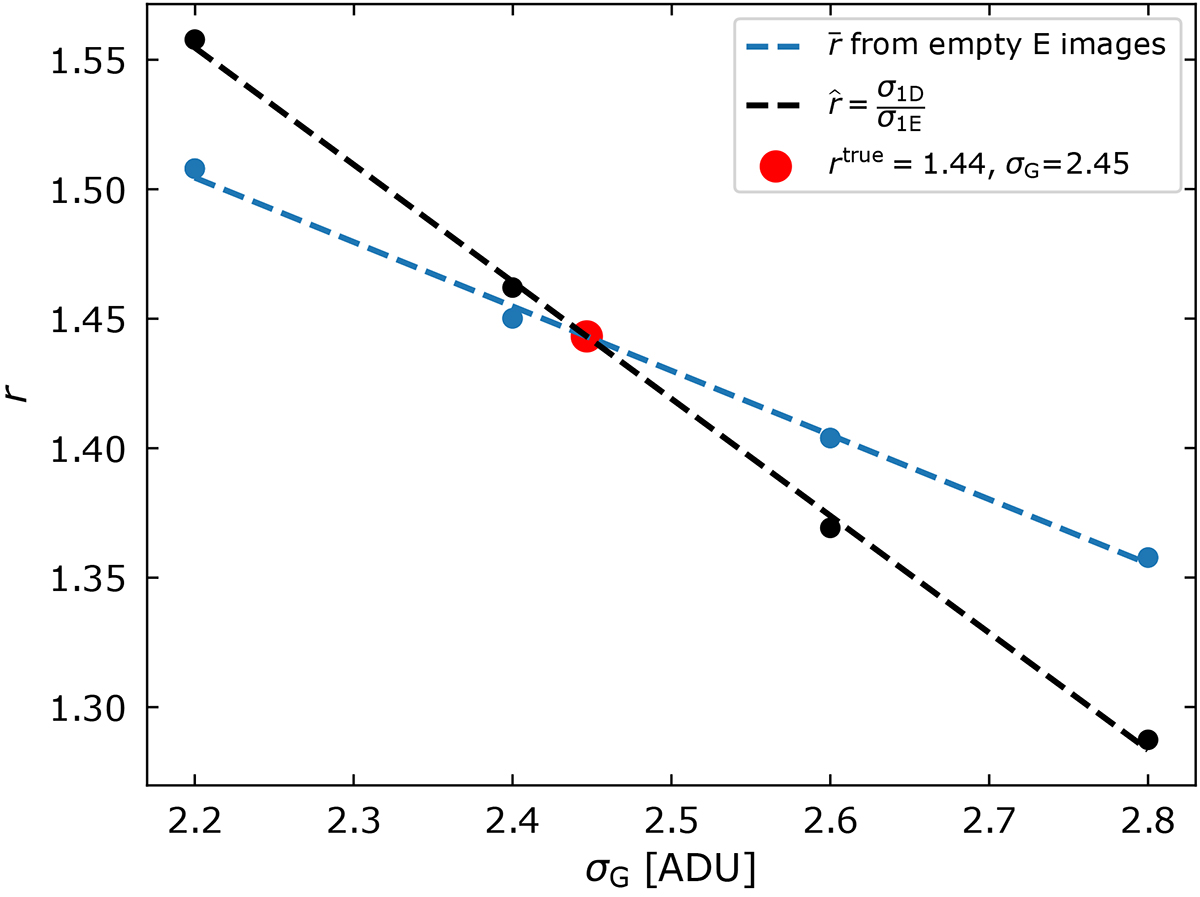
Estimate of the r factor corresponding to the actual value of σG we need to use in the testing environment to both account for the noise correlation and match the noise properties of the E images with the D images. The blue and the black dotted curves show the linear fits to the quantities defined in Eqs. (7) and (8), which were then used in test Ic. Their intersection defines the estimated value for rtrue and the corresponding σG (red dot).
Current usage metrics show cumulative count of Article Views (full-text article views including HTML views, PDF and ePub downloads, according to the available data) and Abstracts Views on Vision4Press platform.
Data correspond to usage on the plateform after 2015. The current usage metrics is available 48-96 hours after online publication and is updated daily on week days.
Initial download of the metrics may take a while.