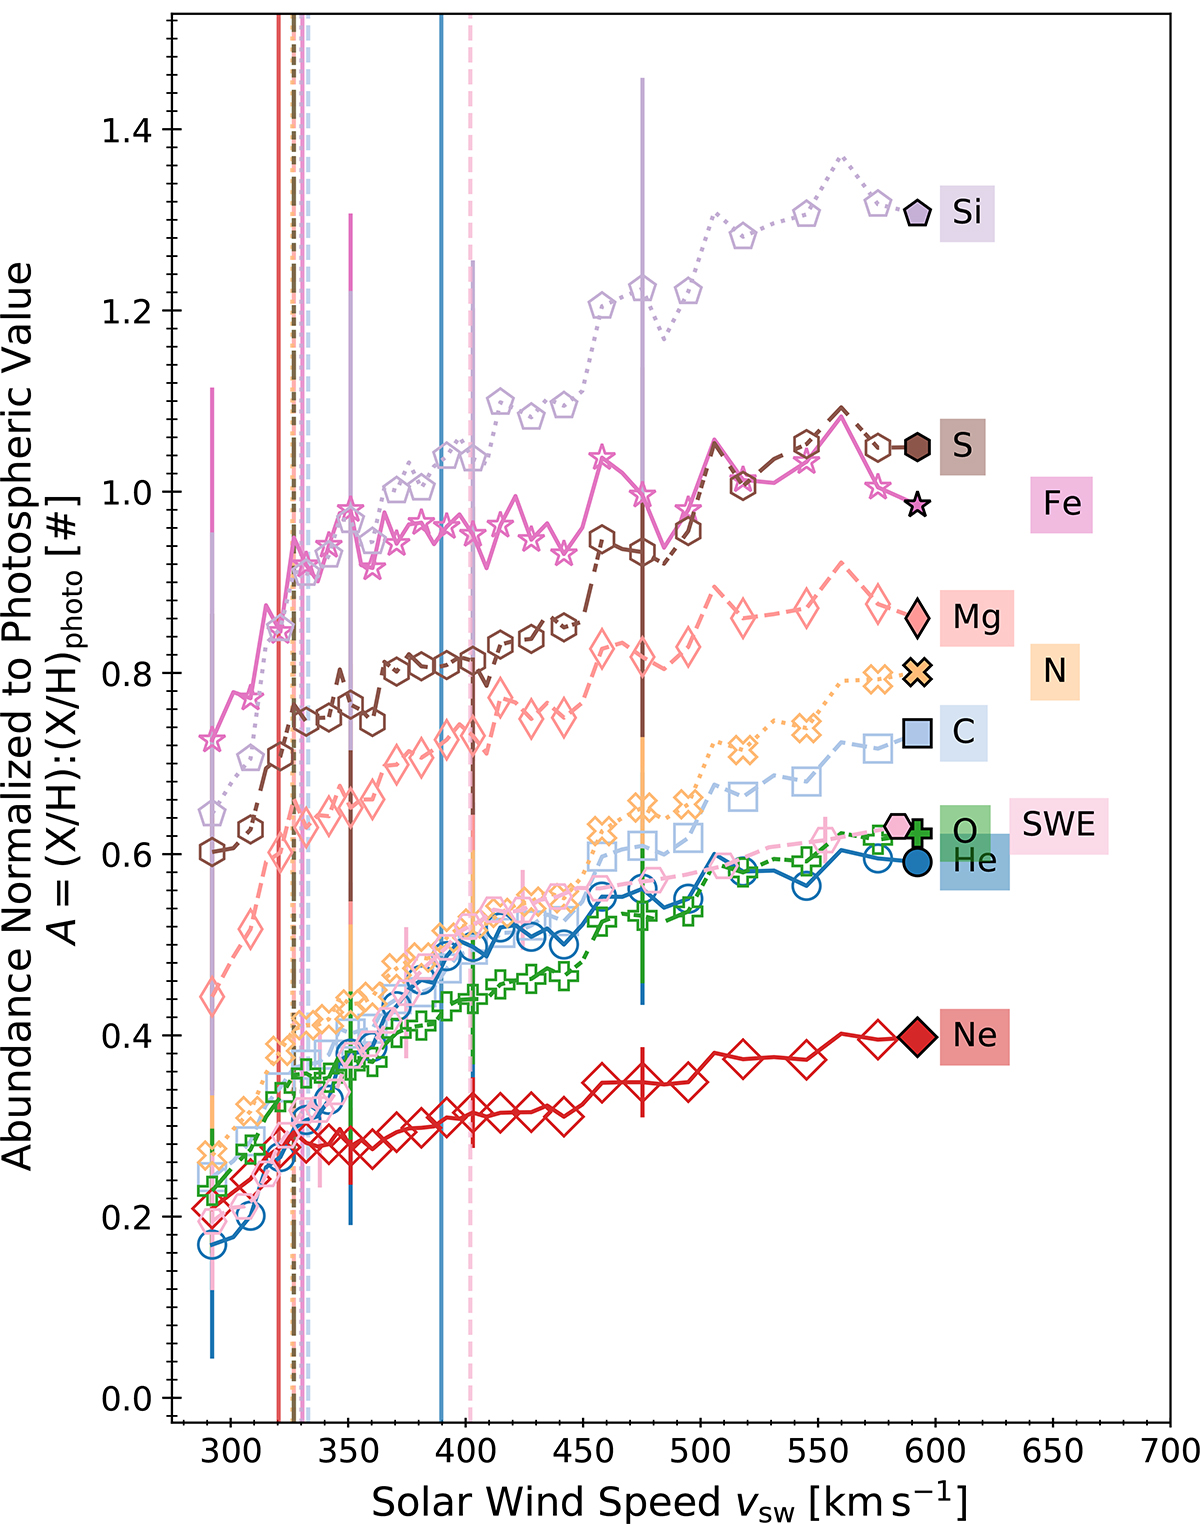
Fig. 2.
Download original image
Abundances averaged in solar wind speed bins. Saturation speeds (vs) are indicated by vertical lines of the corresponding color. The species are indicated on the right hand side of the plot. The SWE observations of AHe from Figure 1 are shown for reference in pink hexagons and labeled SWE. Only every second bin is marked for visual clarity.
Current usage metrics show cumulative count of Article Views (full-text article views including HTML views, PDF and ePub downloads, according to the available data) and Abstracts Views on Vision4Press platform.
Data correspond to usage on the plateform after 2015. The current usage metrics is available 48-96 hours after online publication and is updated daily on week days.
Initial download of the metrics may take a while.