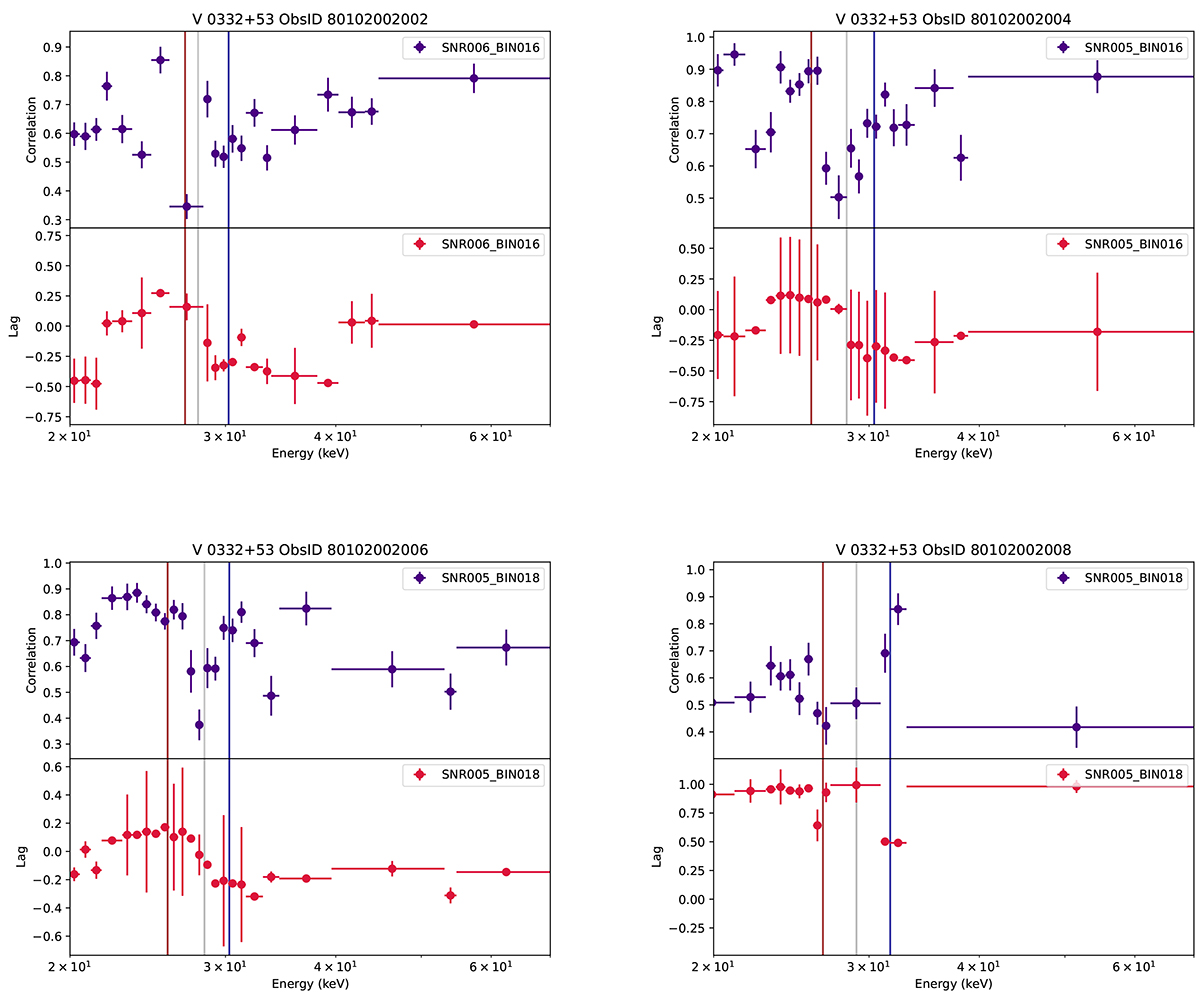
Fig. 8.
Download original image
Cross-correlation and lag spectra for ObsID 802, 804, 806, and 808. The spectra are shown in the high-energy (20–70 keV) range for highlighting the behaviour around the cyclotron line energies. The brown and blue vertical lines mark the positions of the best-fit Gaussians of the PFS. The vertical grey line mark the spectral best-fit position of the cyclotron absorption line (Doroshenko et al. 2016). Lags are given in phase units.
Current usage metrics show cumulative count of Article Views (full-text article views including HTML views, PDF and ePub downloads, according to the available data) and Abstracts Views on Vision4Press platform.
Data correspond to usage on the plateform after 2015. The current usage metrics is available 48-96 hours after online publication and is updated daily on week days.
Initial download of the metrics may take a while.