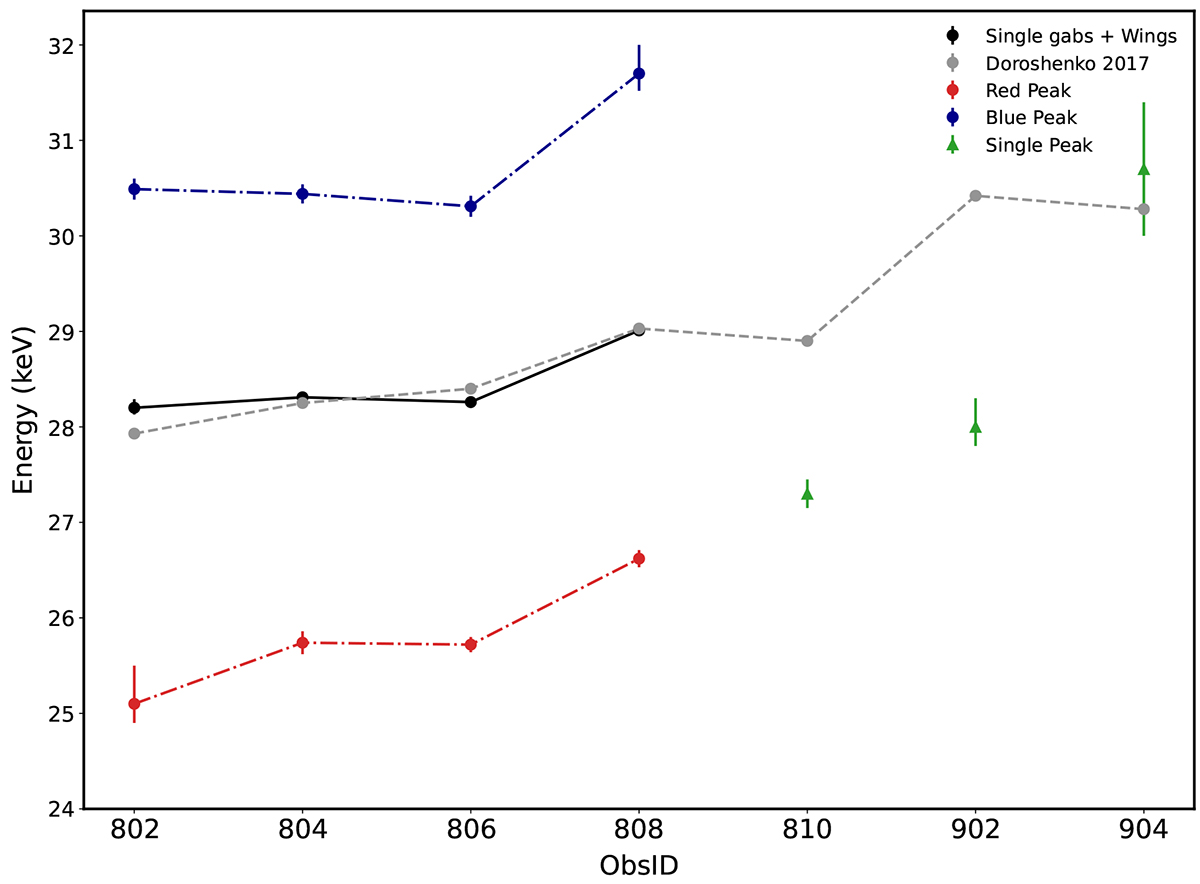
Fig. 6.
Download original image
Best-fitting peak energies of the PFS features and energies of the fundamental cyclotron line for the different observations. We report the cyclotron line energies from the spectral analysis of Doroshenko et al. (2017) (grey dots) and from this work (black dots). Red, blue and green points sign the best-fitting values from the PFS features, when two lines are clearly identified (red and blue dots) and when only one peak has been detected (green dots) (from Tables 2 and 3).
Current usage metrics show cumulative count of Article Views (full-text article views including HTML views, PDF and ePub downloads, according to the available data) and Abstracts Views on Vision4Press platform.
Data correspond to usage on the plateform after 2015. The current usage metrics is available 48-96 hours after online publication and is updated daily on week days.
Initial download of the metrics may take a while.