Fig. 13.
Download original image
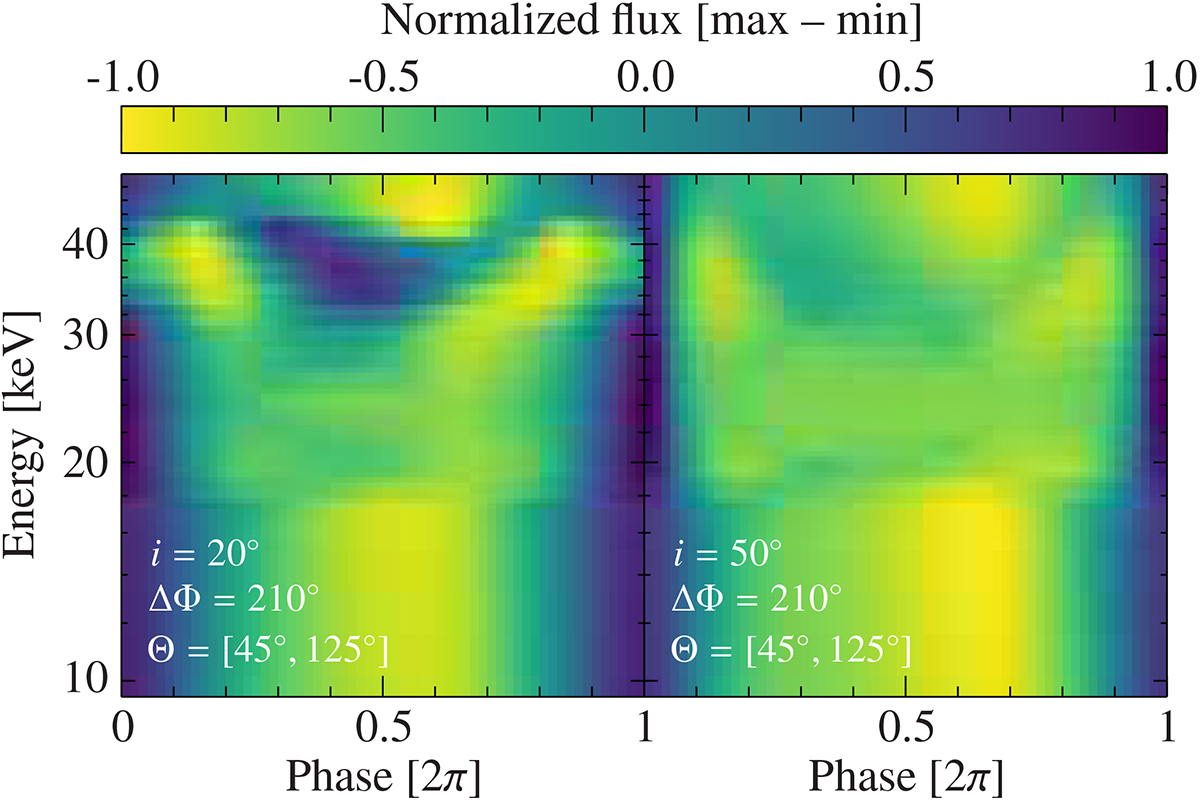
Phase-energy maps simulated from the solution of radiative transfer equation in a slab of highly magnetised plasma based on a model described by Sokolova-Lapa et al. (2023) and combined with relativistic ray tracing by Falkner (2018). A colour map shows the variation of a normalised total observed flux. The two maps are calculated for observer’s inclinations i and the same location of two identically emitting poles, specified by their polar angle from the spin axis Θ and their azimuthal separation ΔΦ (the values are indicated on the panels). For the geometry displayed on the left, phase shifts occur over a broad range around the line, being caused by the redistribution of photons in the wings. The blue wing is particularly strongly affected by the process due to relatively high electron temperature kT = 7 keV.
Current usage metrics show cumulative count of Article Views (full-text article views including HTML views, PDF and ePub downloads, according to the available data) and Abstracts Views on Vision4Press platform.
Data correspond to usage on the plateform after 2015. The current usage metrics is available 48-96 hours after online publication and is updated daily on week days.
Initial download of the metrics may take a while.