Open Access
Fig. 11.
Download original image
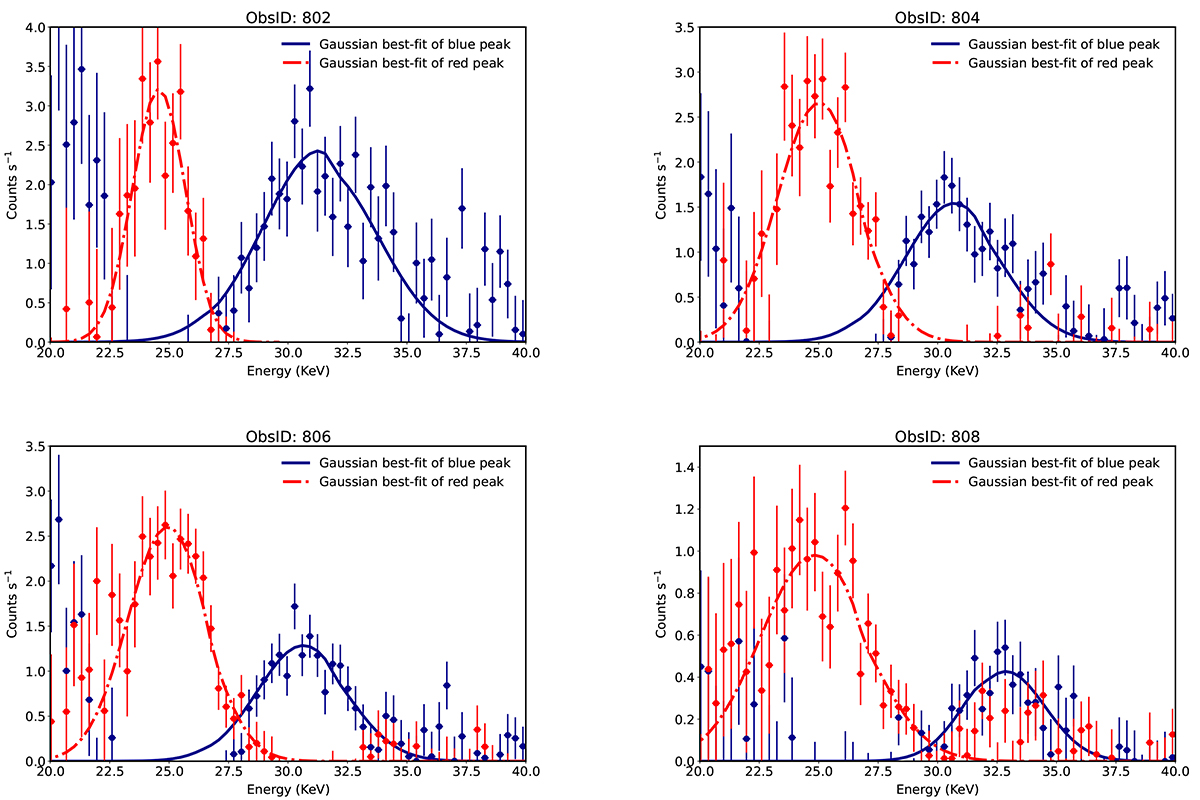
Spectral characterisation of the phase-resolved peak excesses for ObsIDs 802, 804, 806, and 808. Each panel shows the photon excesses per energy bin for the blue (blue data) and the red peak (red data). The Gaussian best-fitting model for the red (blue) dataset is marked by a thick red (blue) line.
Current usage metrics show cumulative count of Article Views (full-text article views including HTML views, PDF and ePub downloads, according to the available data) and Abstracts Views on Vision4Press platform.
Data correspond to usage on the plateform after 2015. The current usage metrics is available 48-96 hours after online publication and is updated daily on week days.
Initial download of the metrics may take a while.