Open Access
Fig. 10.
Download original image
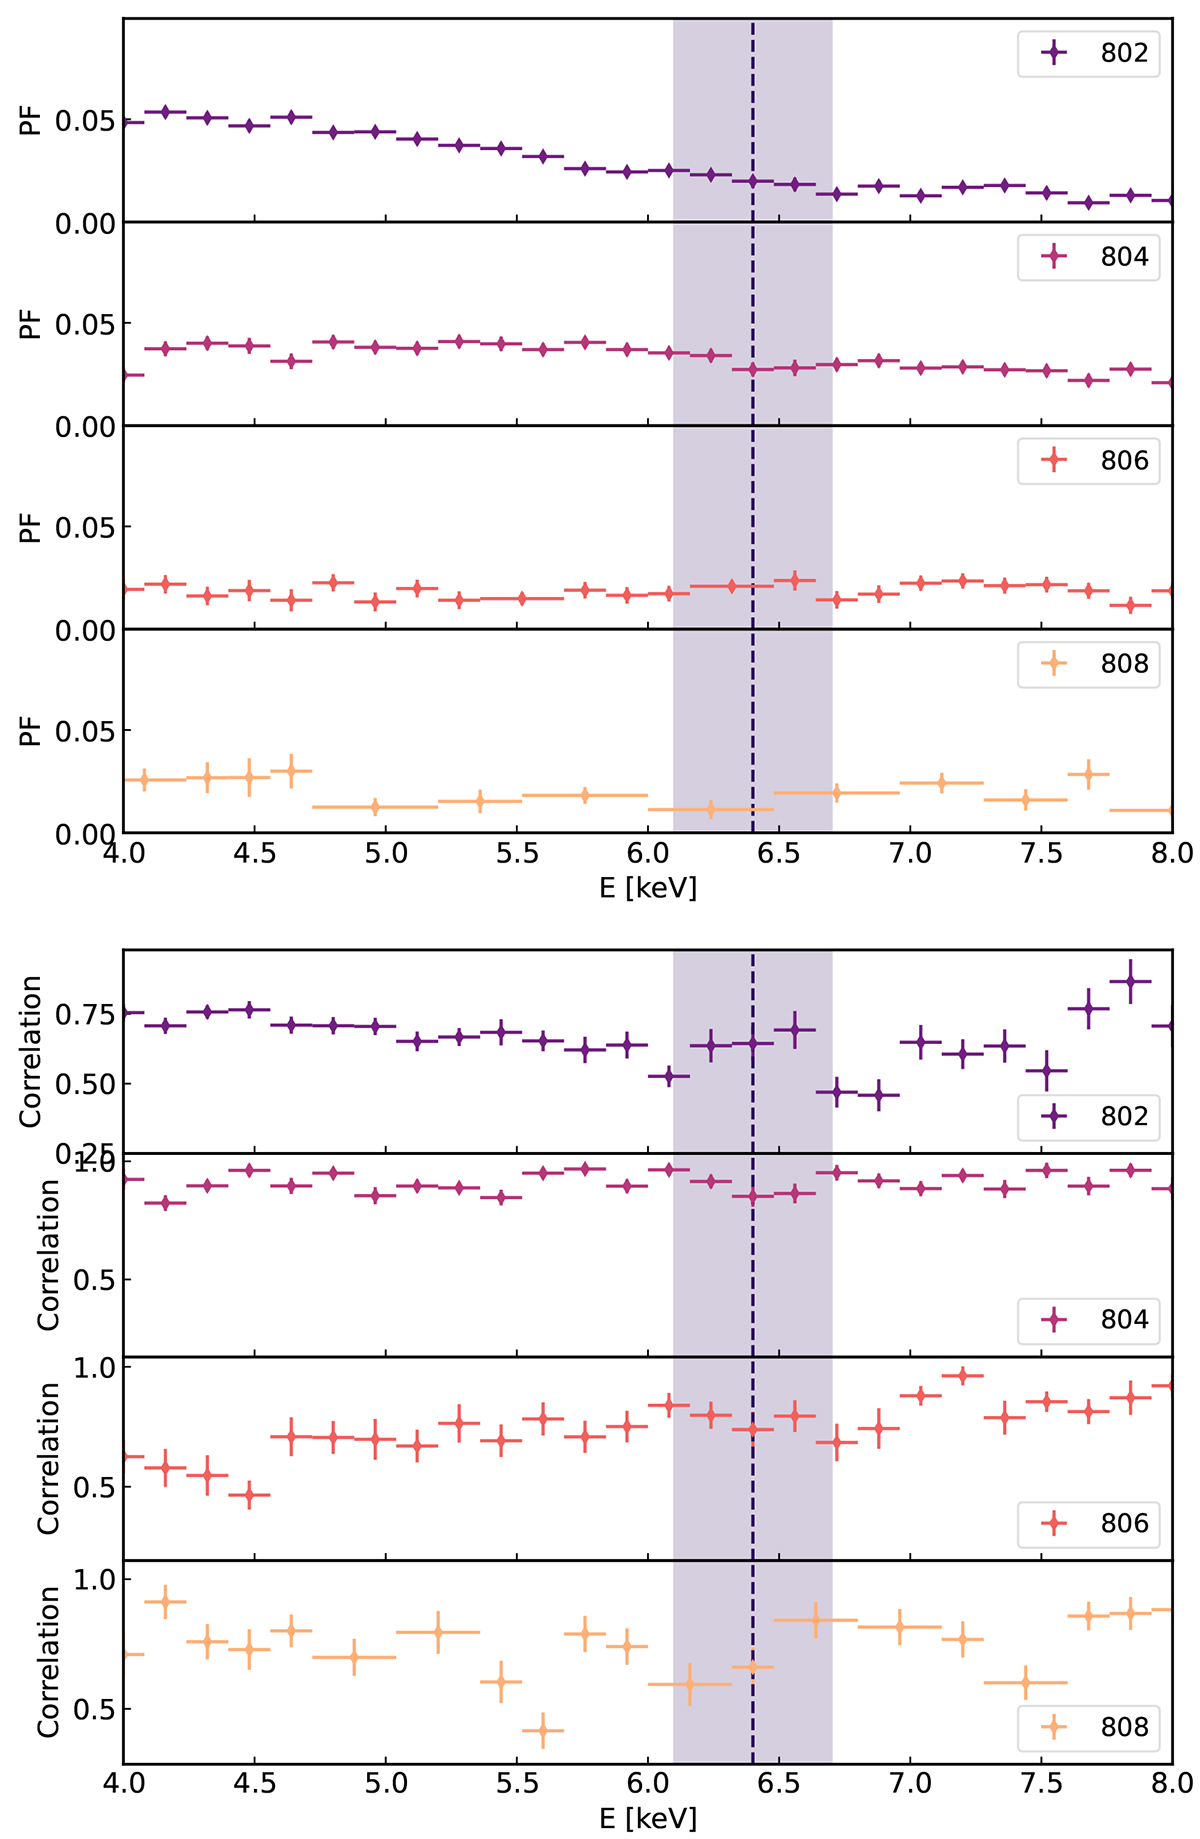
Pulsed fraction values (upper panel) and CC spectra (lower panel) for ObsID 802,804,806 and 808 in the 4–9 keV energy range. The position and width of the spectral emission iron line is marked by the dotted line and the purple-coloured area (1-sigma contour).
Current usage metrics show cumulative count of Article Views (full-text article views including HTML views, PDF and ePub downloads, according to the available data) and Abstracts Views on Vision4Press platform.
Data correspond to usage on the plateform after 2015. The current usage metrics is available 48-96 hours after online publication and is updated daily on week days.
Initial download of the metrics may take a while.