Open Access
Fig. 1.
Download original image
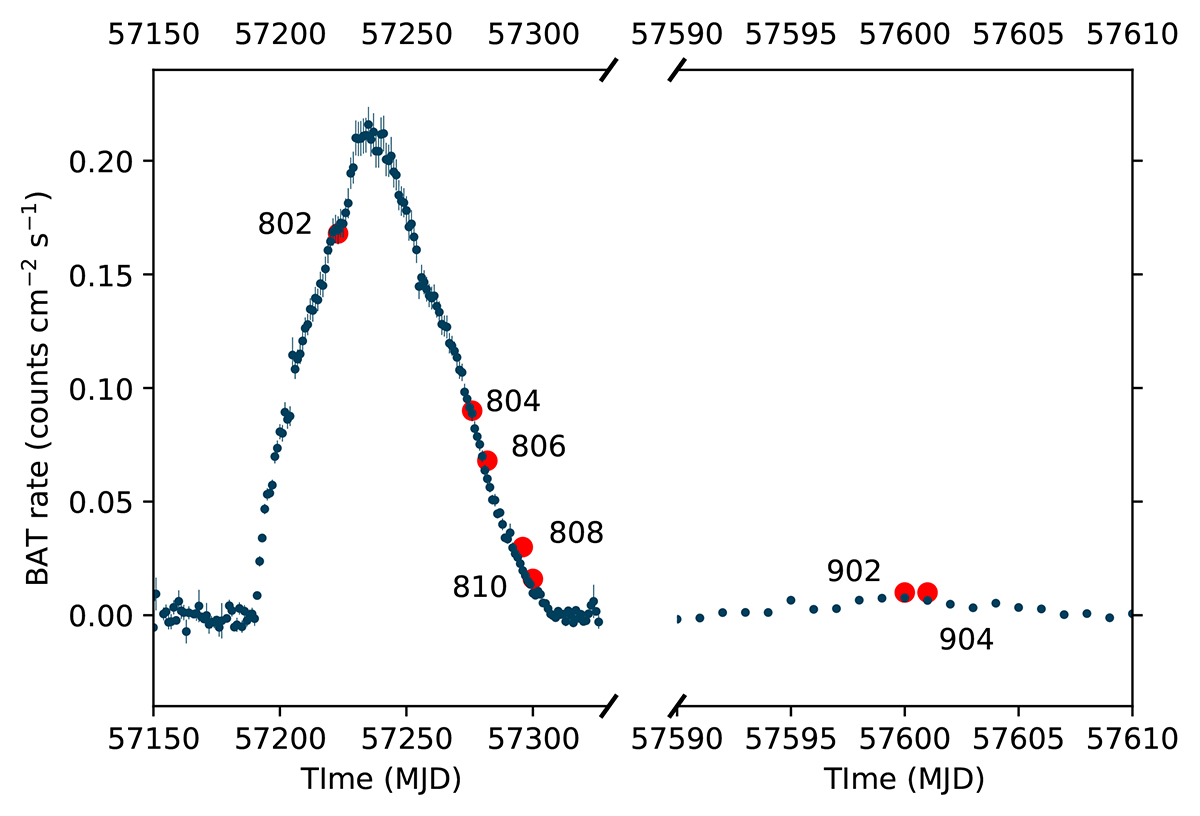
Swift/BAT light curve of V 0332+53 during its 2015 outburst and at the time of the 2016 failed outburst. Times of NuSTAR observations are marked by the red points.
Current usage metrics show cumulative count of Article Views (full-text article views including HTML views, PDF and ePub downloads, according to the available data) and Abstracts Views on Vision4Press platform.
Data correspond to usage on the plateform after 2015. The current usage metrics is available 48-96 hours after online publication and is updated daily on week days.
Initial download of the metrics may take a while.