Fig. 5
Download original image
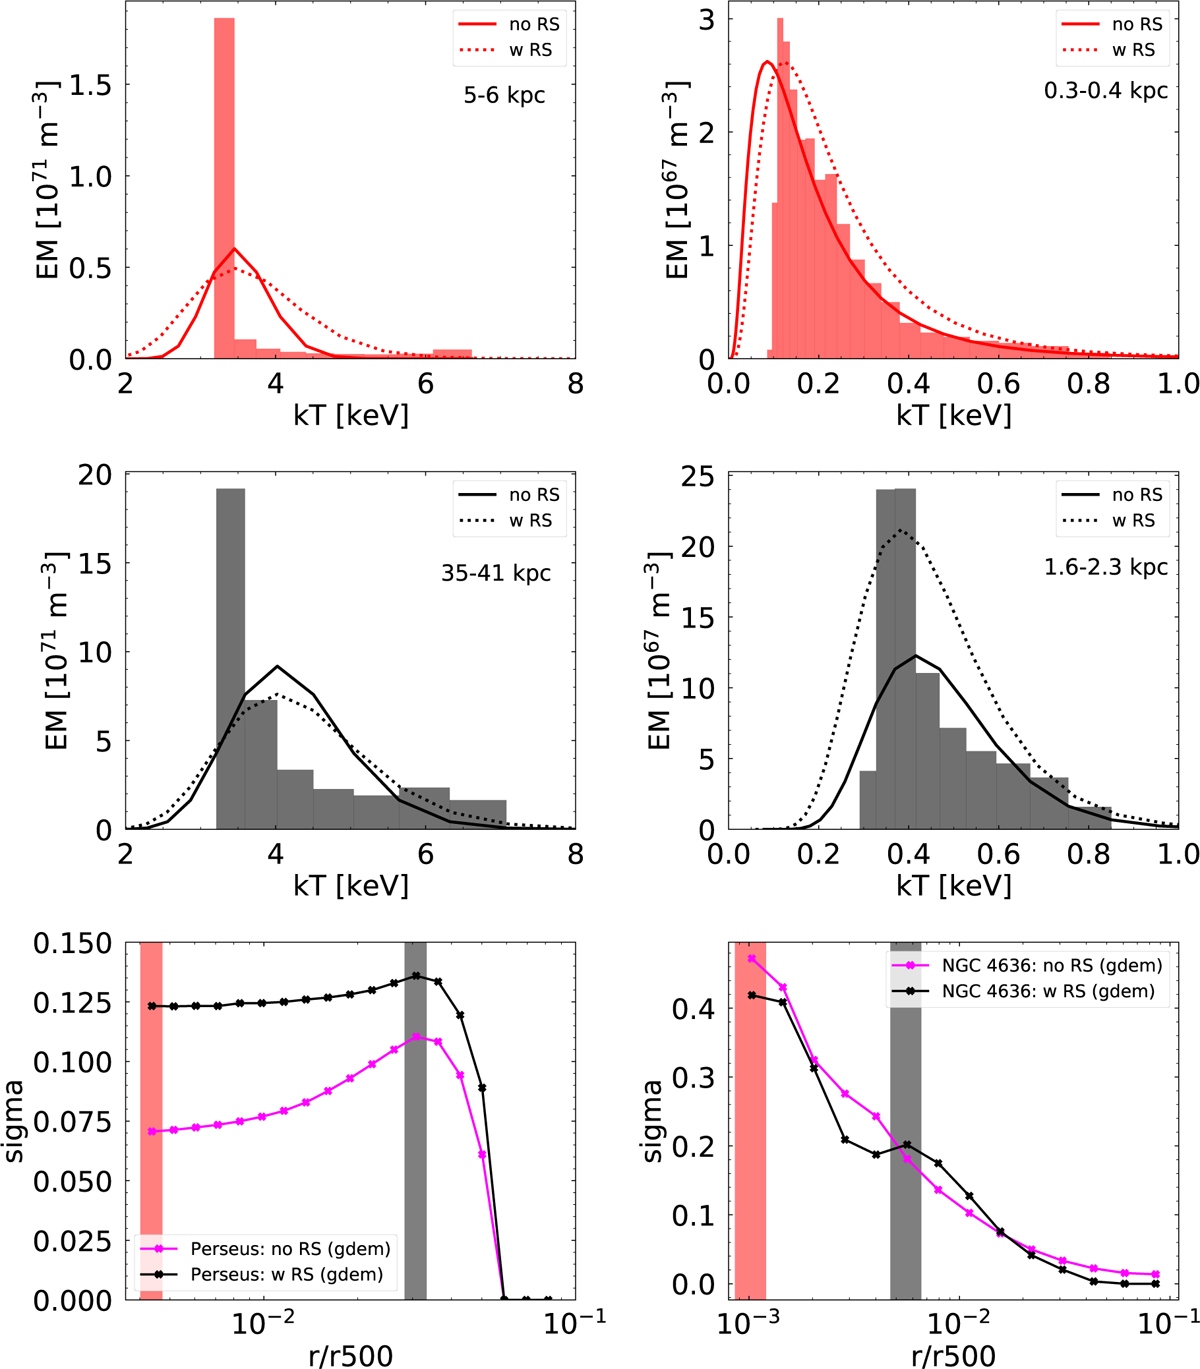
Emission measure distribution as a function of temperature for the Perseus cluster (left panels) and NGC 4636 (right panels). The different colours represent different shells that were used to extract the input emission measure distribution as described in Sect. 3.1.4 (plotted with histograms). The Gaussian functions in each plot were obtained following Eq. (14) and by using the best-fit values obtained and described in more details in Sect. 3.1. The bottom row shows the radial profile of best-fit values of σ for the Perseus cluster and NGC 4636, where the red and black bars correspond to radial bins used for deriving the EM distribution in the first two rows of this figure.
Current usage metrics show cumulative count of Article Views (full-text article views including HTML views, PDF and ePub downloads, according to the available data) and Abstracts Views on Vision4Press platform.
Data correspond to usage on the plateform after 2015. The current usage metrics is available 48-96 hours after online publication and is updated daily on week days.
Initial download of the metrics may take a while.