Fig. 2
Download original image
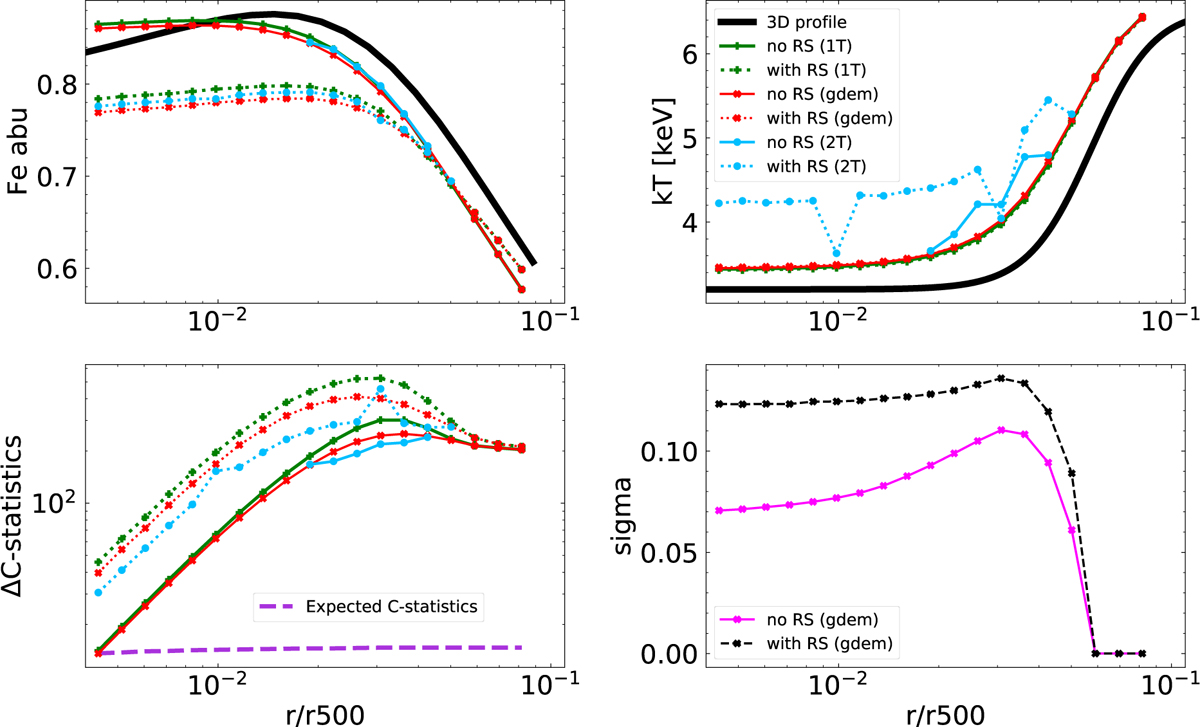
Best-fit values of the iron abundance and temperature for spectra of the Perseus cluster simulated with Chandra ACIS-S. Spectra without RS (solid lines) and with RS (dotted lines) were fitted with 1T (green lines), 2T (blue lines), and gdem (red lines) models as described in Sect. 2.4. The top panels show the best-fit iron abundance values (top left) and best-fit temperature values (top right) together with the 3D profiles (black lines) defined in Eqs. (8) and (4), respectively. The bottom-left panel shows the values of the ΔC-statistics and the expected value of the C-statistics (purple dashed line; see Sect. 2.4 for more details). The bottom-right panel shows the best-fit value of the σ parameter, which is defined in the gdem model as the width of the Gaussian distribution of the emission measure as a function of temperature. Since the simulated data does not include the Poisson noise, the values of the ΔC-statistics that are below the purple curve indicate an acceptable fit. Spectra for every radial bin were simulated assuming an exposure time of 500 ks.
Current usage metrics show cumulative count of Article Views (full-text article views including HTML views, PDF and ePub downloads, according to the available data) and Abstracts Views on Vision4Press platform.
Data correspond to usage on the plateform after 2015. The current usage metrics is available 48-96 hours after online publication and is updated daily on week days.
Initial download of the metrics may take a while.