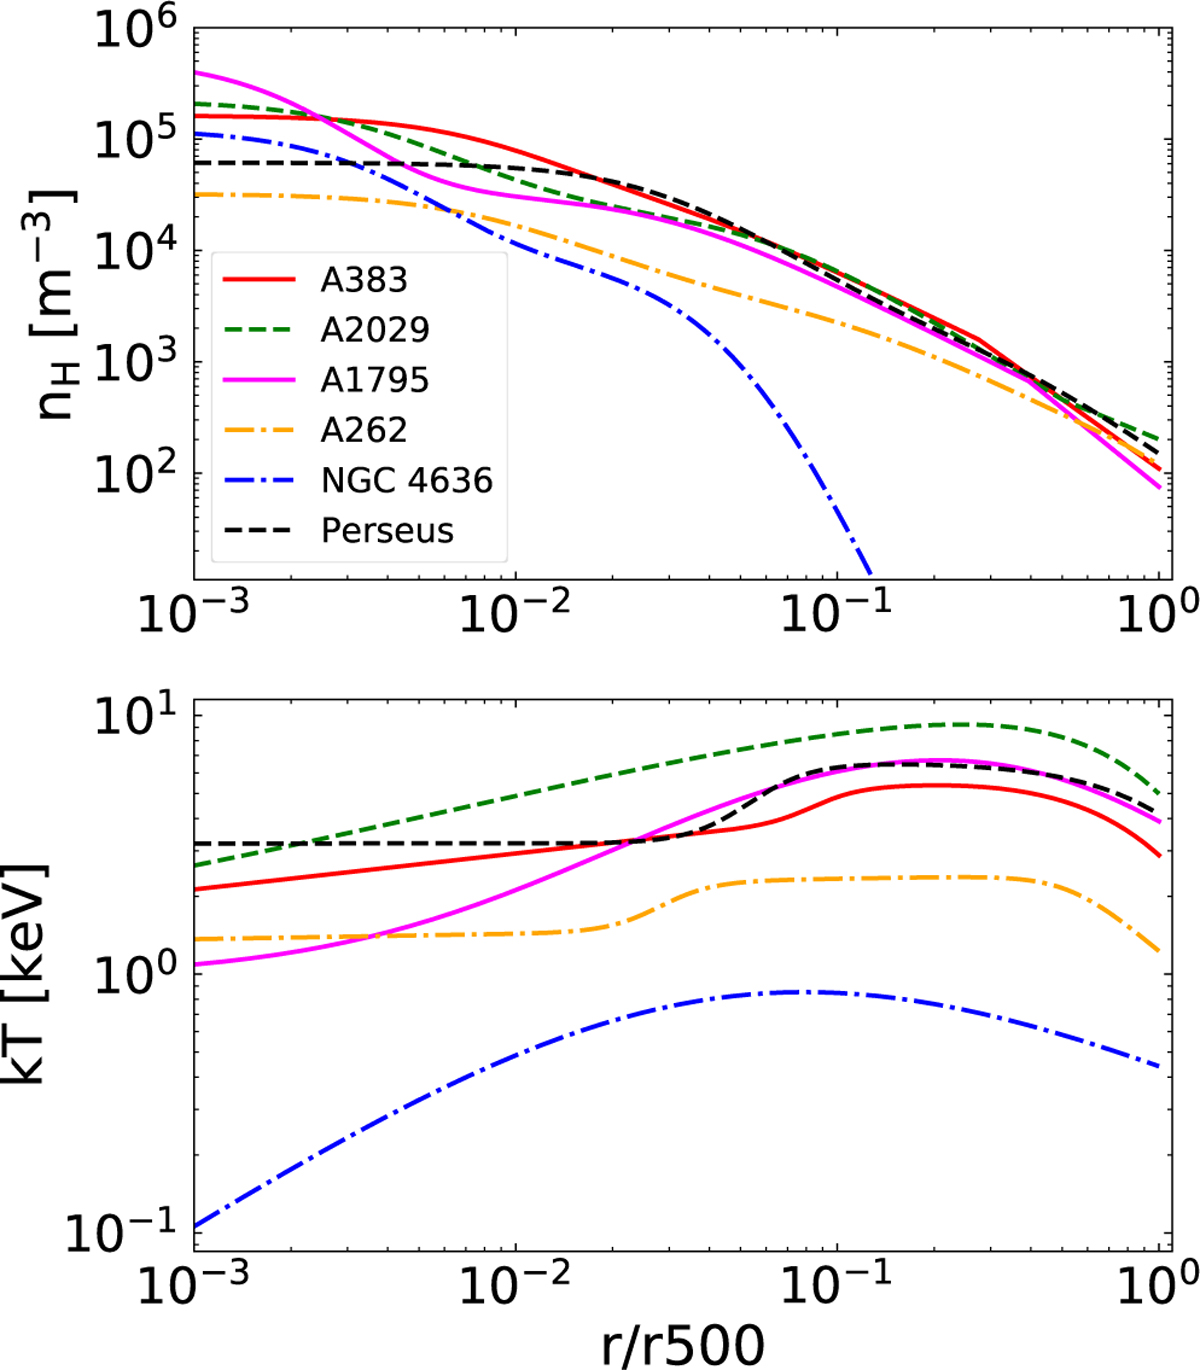
Fig. 1
Download original image
Input radial profiles of hydrogen density nH (top panel) and temperature kT (bottom panel) for the sample selection from Table 1. These profiles were obtained by fitting the functional forms of density and temperature profiles as defined in Sects. 2.2.1 and 2.2.2 to the profiles given in Vikhlinin et al. (2006) (for galaxy clusters A383, A2029, A1795, and A262), to data from Baldi et al. (2009) (for NGC 4636), and to data from Zhuravleva et al. (2015) (for the Perseus cluster).
Current usage metrics show cumulative count of Article Views (full-text article views including HTML views, PDF and ePub downloads, according to the available data) and Abstracts Views on Vision4Press platform.
Data correspond to usage on the plateform after 2015. The current usage metrics is available 48-96 hours after online publication and is updated daily on week days.
Initial download of the metrics may take a while.