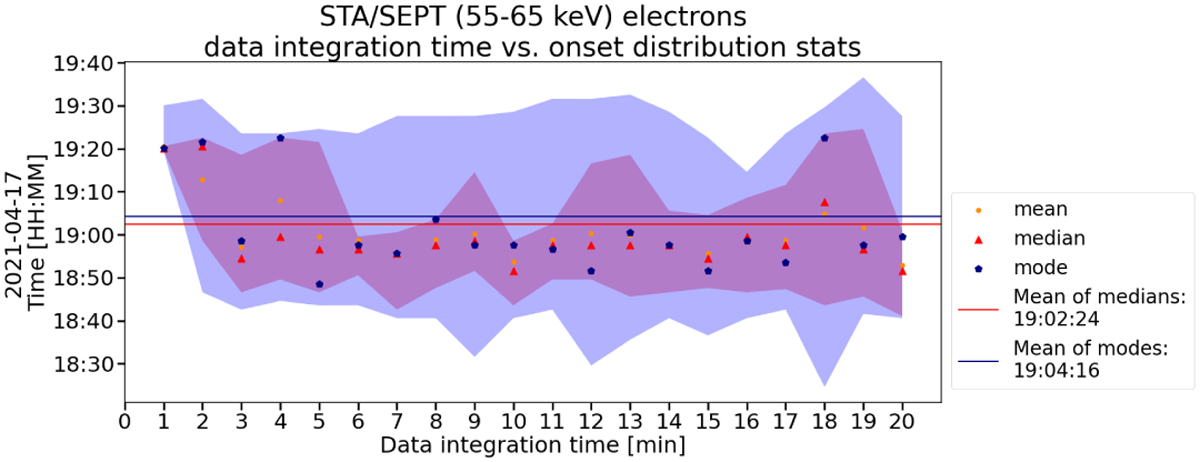
Fig. 6

Download original image
Set of 20 distributions of electron onset times as a function of data integration time using STEREO-A / SEPT 55-65 keV electron data from the April 17, 2021 SEP event. Each distribution consists of 1000 possible onsets, and its mean, median, and mode are marked in the plot with a yellow circle, red triangle, and a blue pentagon, respectively. The purple and blue areas mark the times that bound ~68 and ~95% of the distribution.
Current usage metrics show cumulative count of Article Views (full-text article views including HTML views, PDF and ePub downloads, according to the available data) and Abstracts Views on Vision4Press platform.
Data correspond to usage on the plateform after 2015. The current usage metrics is available 48-96 hours after online publication and is updated daily on week days.
Initial download of the metrics may take a while.


