Fig. 5
Download original image
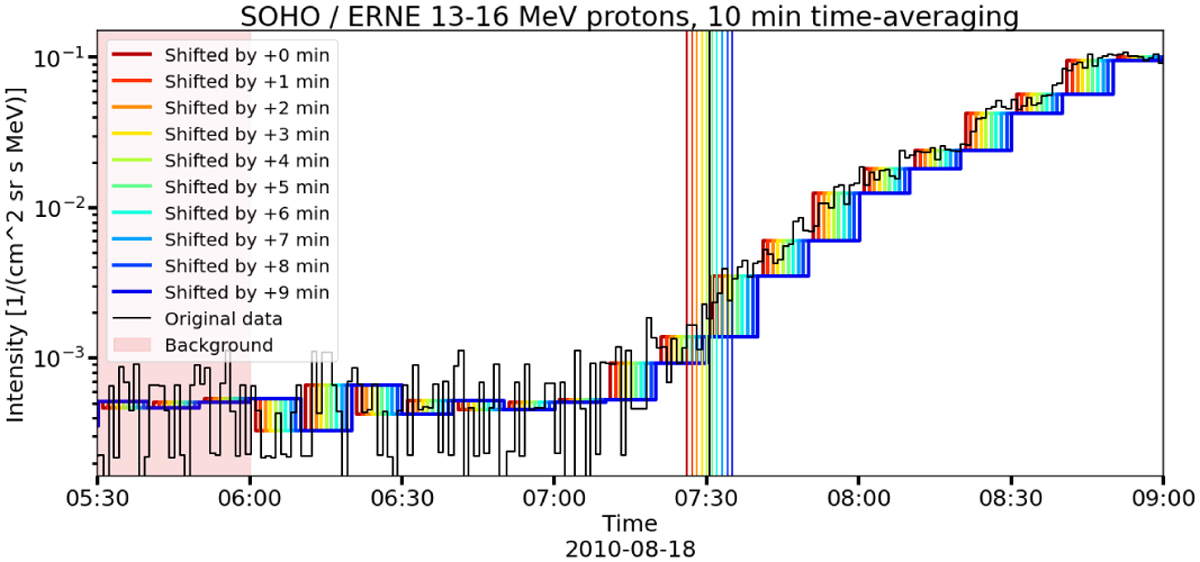
SOHO / ERNE (13–16 MeV) protons in the August 18, 2010 SEP event. We superpose on the intensity data in native cadence (black curve) the ten-minute time-averaged version of the data along with their nine copies, which are all shifted forward in time in one-minute intervals (rainbow-colored curves). The onset found by Poisson-CUSUM for the native data is marked with a vertical black line, and the onsets found for the ten ten-minute data time series are marked with a vertical line whose colors correspond to the time series.
Current usage metrics show cumulative count of Article Views (full-text article views including HTML views, PDF and ePub downloads, according to the available data) and Abstracts Views on Vision4Press platform.
Data correspond to usage on the plateform after 2015. The current usage metrics is available 48-96 hours after online publication and is updated daily on week days.
Initial download of the metrics may take a while.