Fig. 4
Download original image
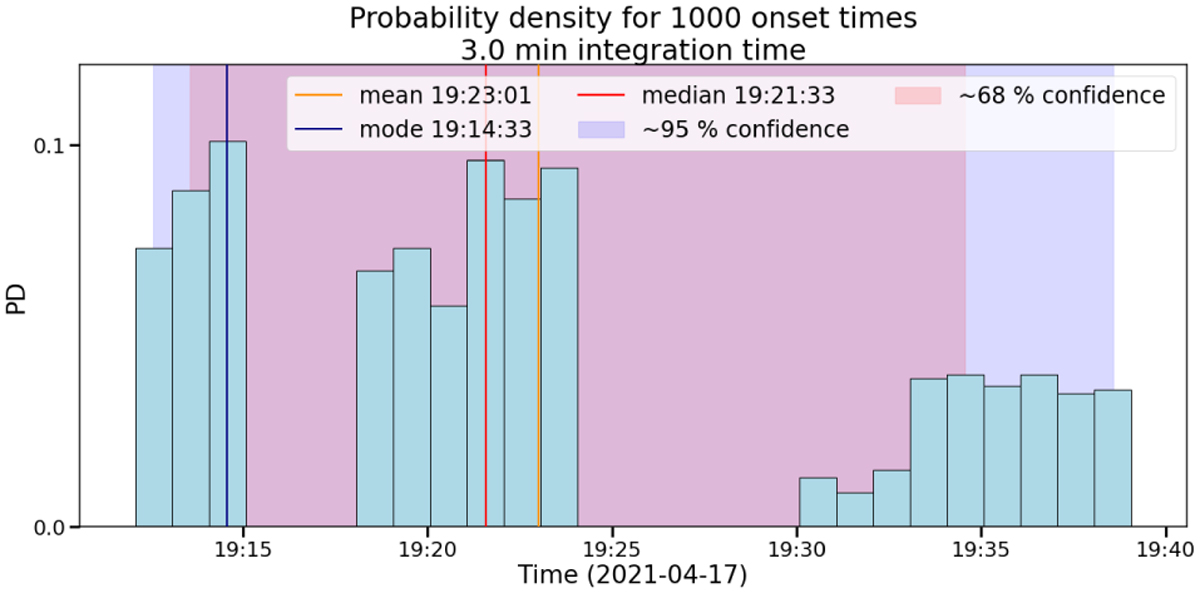
Distribution of onset times produced by the method for STEREO-A / SEPT 85–105 keV electrons from the SEP event of April 17, 2021. These are the same spacecraft, instrument, particle species, energy range, and event as in Fig. 3. The mean, median, and mode of the distribution are marked with vertical orange, red and blue lines, respectively. The red shading behind the histogram shows the times that bound ~68% of the distribution, and the blue shading bounds ~95% of the distribution.
Current usage metrics show cumulative count of Article Views (full-text article views including HTML views, PDF and ePub downloads, according to the available data) and Abstracts Views on Vision4Press platform.
Data correspond to usage on the plateform after 2015. The current usage metrics is available 48-96 hours after online publication and is updated daily on week days.
Initial download of the metrics may take a while.