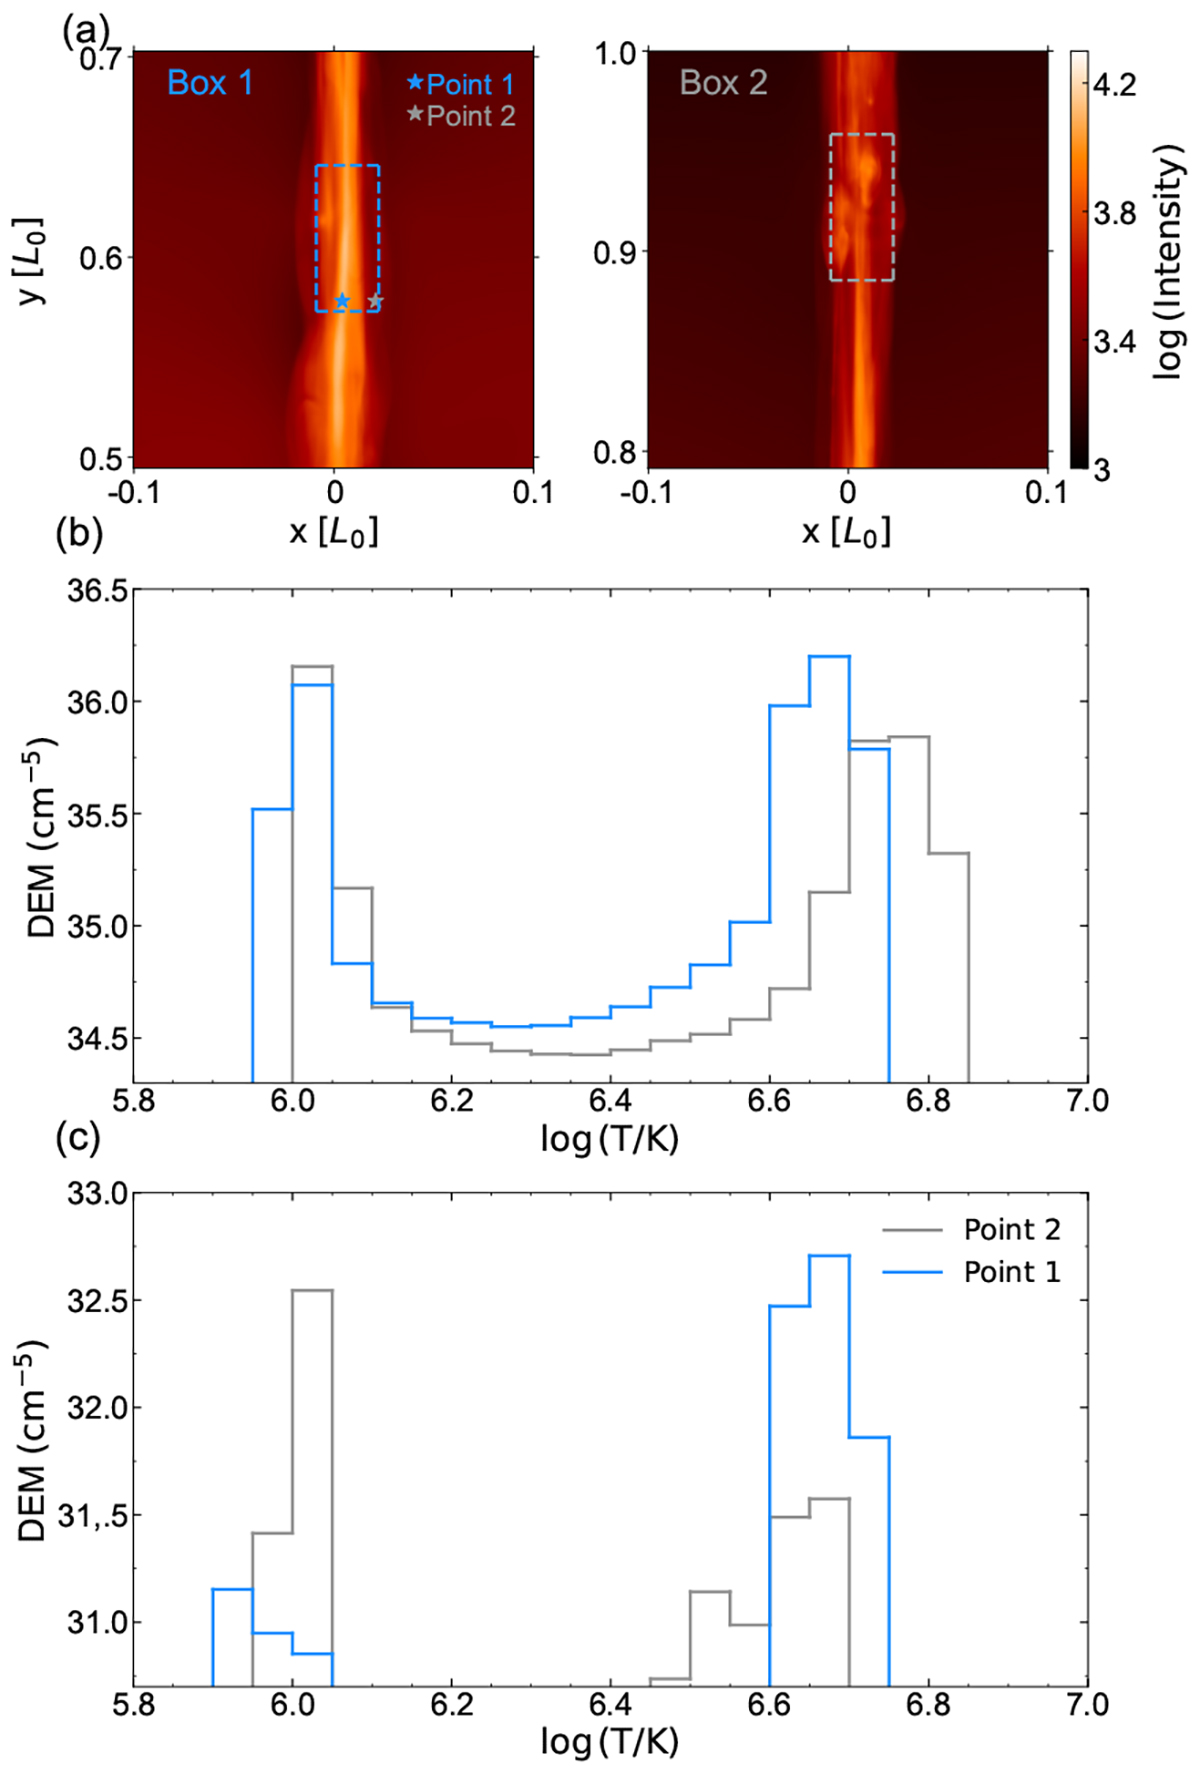
Fig. 6.
Download original image
DEM of the current sheet at two specific regions. Panel (a): Two zoomed-in regions of the XRT image of the current sheet at t = 8.2. The left region encloses a ray-like segment, and the right one contains several plasmoids. Panel (b): DEMs of box 1 and box 2, labeled in panel (a). The DEM is derived following the method proposed by Guennou et al. (2012). We collect the temperature information of grid points within the boxes for statistics; the bin size of DEMs is log T = 0.05. Panel (c): DEMs of two points, marked by stars in panel (a).
Current usage metrics show cumulative count of Article Views (full-text article views including HTML views, PDF and ePub downloads, according to the available data) and Abstracts Views on Vision4Press platform.
Data correspond to usage on the plateform after 2015. The current usage metrics is available 48-96 hours after online publication and is updated daily on week days.
Initial download of the metrics may take a while.