Fig. 3.
Download original image
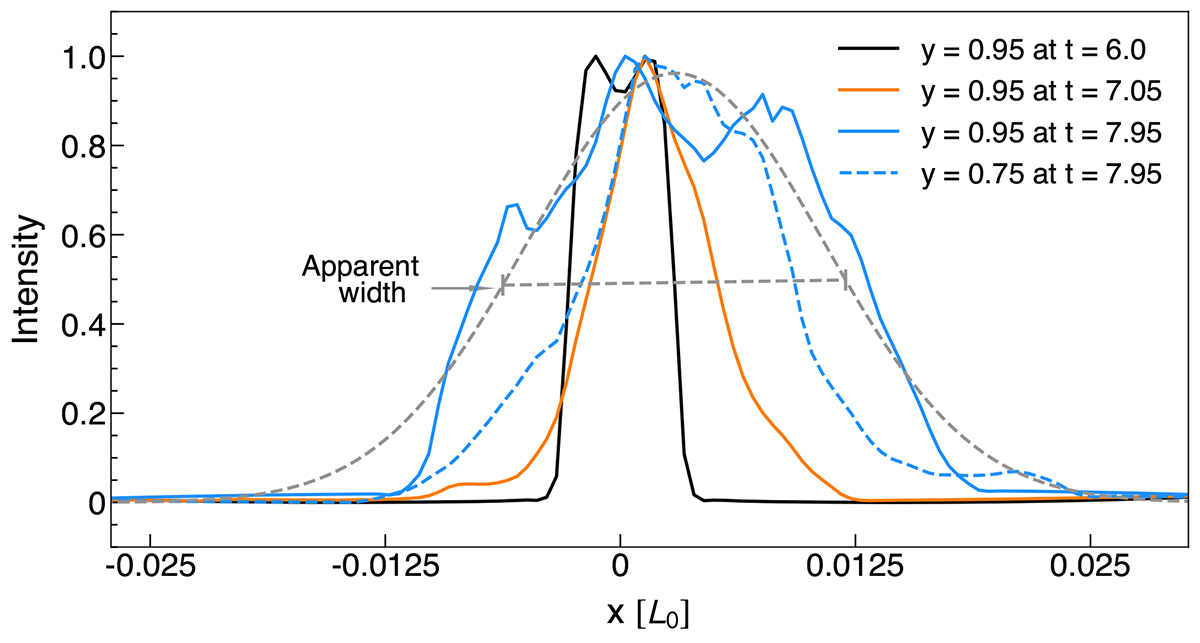
Profiles of synthetic XRT intensity across the current sheet at different moments. The solid curves with different colors depict the intensity profiles at three typical moments, namely t = 6, 7.05, and 7.95, sampled along the x-direction slit at y = 0.95 (see the solid white line in Fig. 2a). The dashed blue curve shows the result of another slit (y = 0.75) at t = 7.95 (see the dashed white line in Fig. 2a). The dashed gray curve denotes the single Gaussian fitted to the solid blue curve, on which the definition of the apparent width is marked. All these curves have been normalized by their maximum value for a better comparison.
Fig. 4.
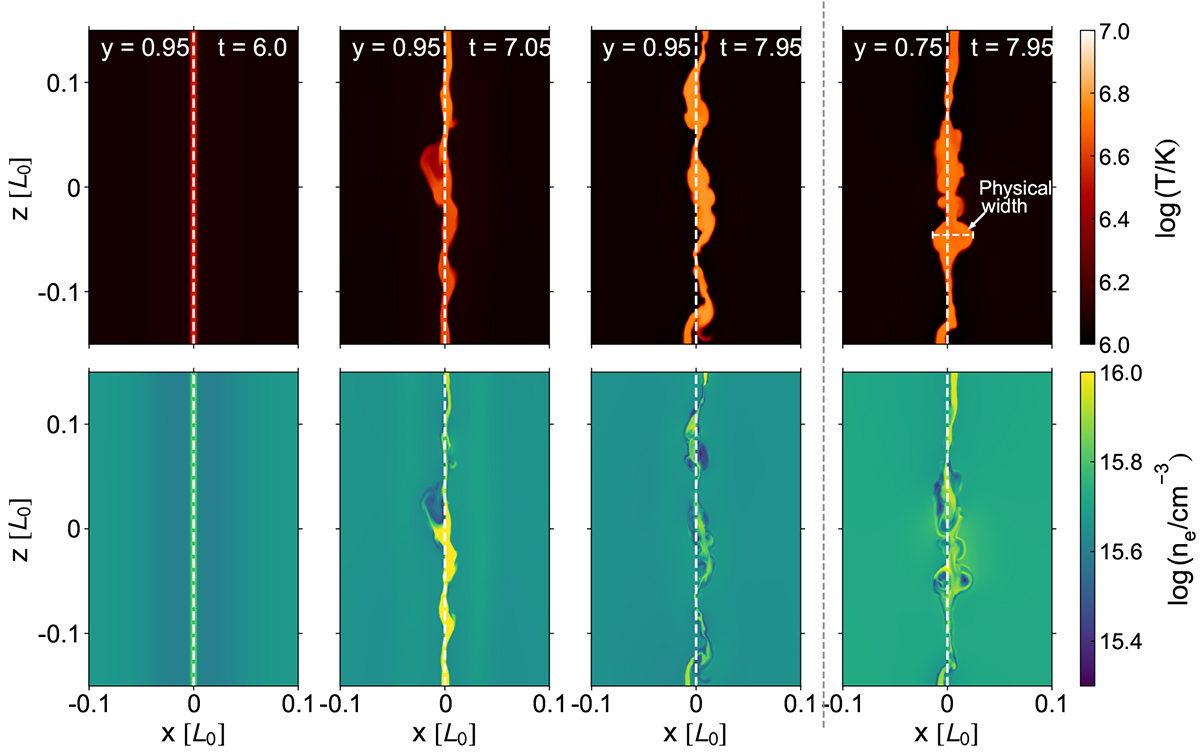
Horizontal slices of temperature (first row) and density (second row) at typical moments, the same as in Fig. 3. The first three columns depict the slices of y = 0.95 at t = 6, 7.05, and 7.95, and the fourth column plots the slice of y = 0.75 at t = 7.95 on which the definition of the physical width is denoted. The dashed white lines mark the position of x = 0.
Current usage metrics show cumulative count of Article Views (full-text article views including HTML views, PDF and ePub downloads, according to the available data) and Abstracts Views on Vision4Press platform.
Data correspond to usage on the plateform after 2015. The current usage metrics is available 48-96 hours after online publication and is updated daily on week days.
Initial download of the metrics may take a while.