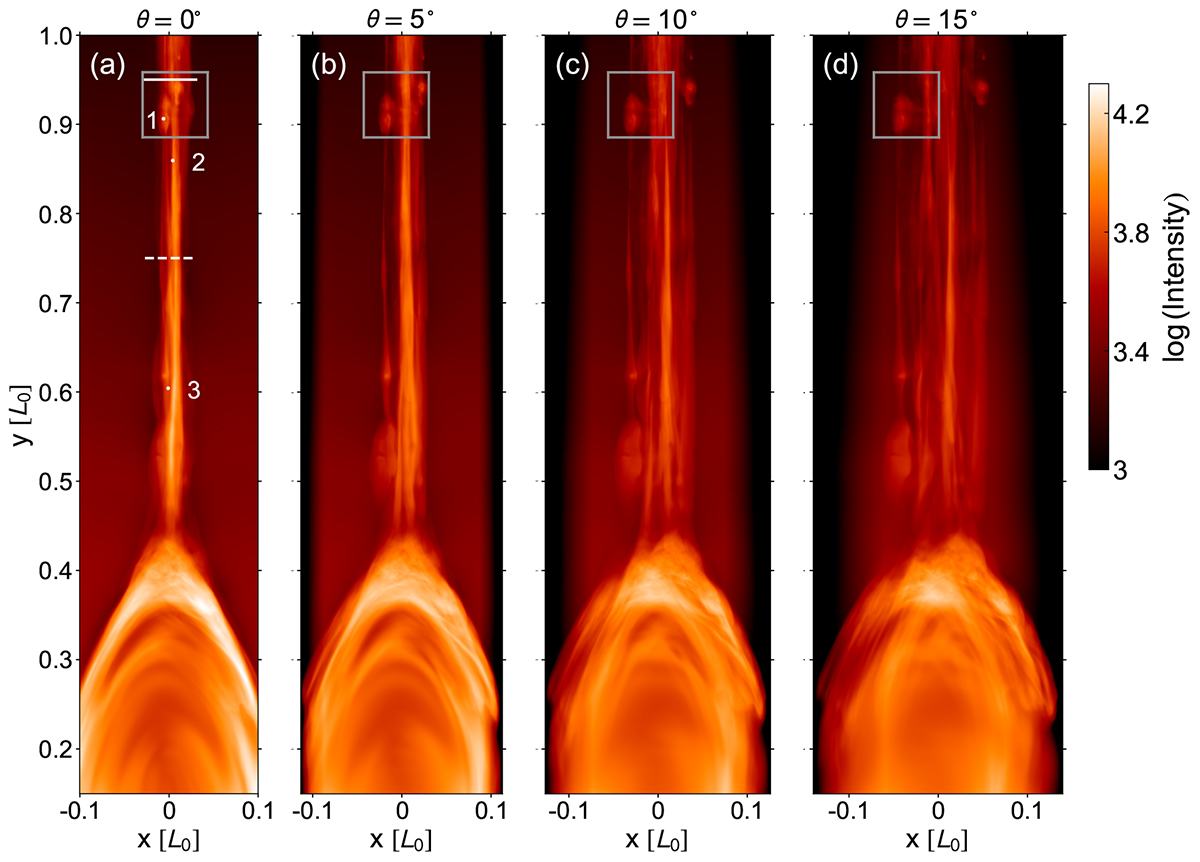
Fig. 2.
Download original image
Synthetic X-ray Telescope (XRT) Al-poly/open images of the flare current sheet as observed from different perspectives at t = 8.2. Panel (a): Edge-on view, with the LOS in the z-direction. θ denotes the acute angle between the LOS and the z-axis. The gray boxes in all panels enclose a plasmoid as also highlighted in Fig. 1. The optical thin assumption has been adopted for synthesizing (see Wang et al. 2023b, for details). Panel (a): Two x-direction slits used to analyze the apparent and physical widths in Figs. 3 and 4. The three dots mark the ends of three slits along the z-direction used in Fig. 8. The spatial resolution of XRT is 2 arcsec (∼1500 km; Golub et al. 2007), corresponding to 0.03L0 in the simulation.
Current usage metrics show cumulative count of Article Views (full-text article views including HTML views, PDF and ePub downloads, according to the available data) and Abstracts Views on Vision4Press platform.
Data correspond to usage on the plateform after 2015. The current usage metrics is available 48-96 hours after online publication and is updated daily on week days.
Initial download of the metrics may take a while.