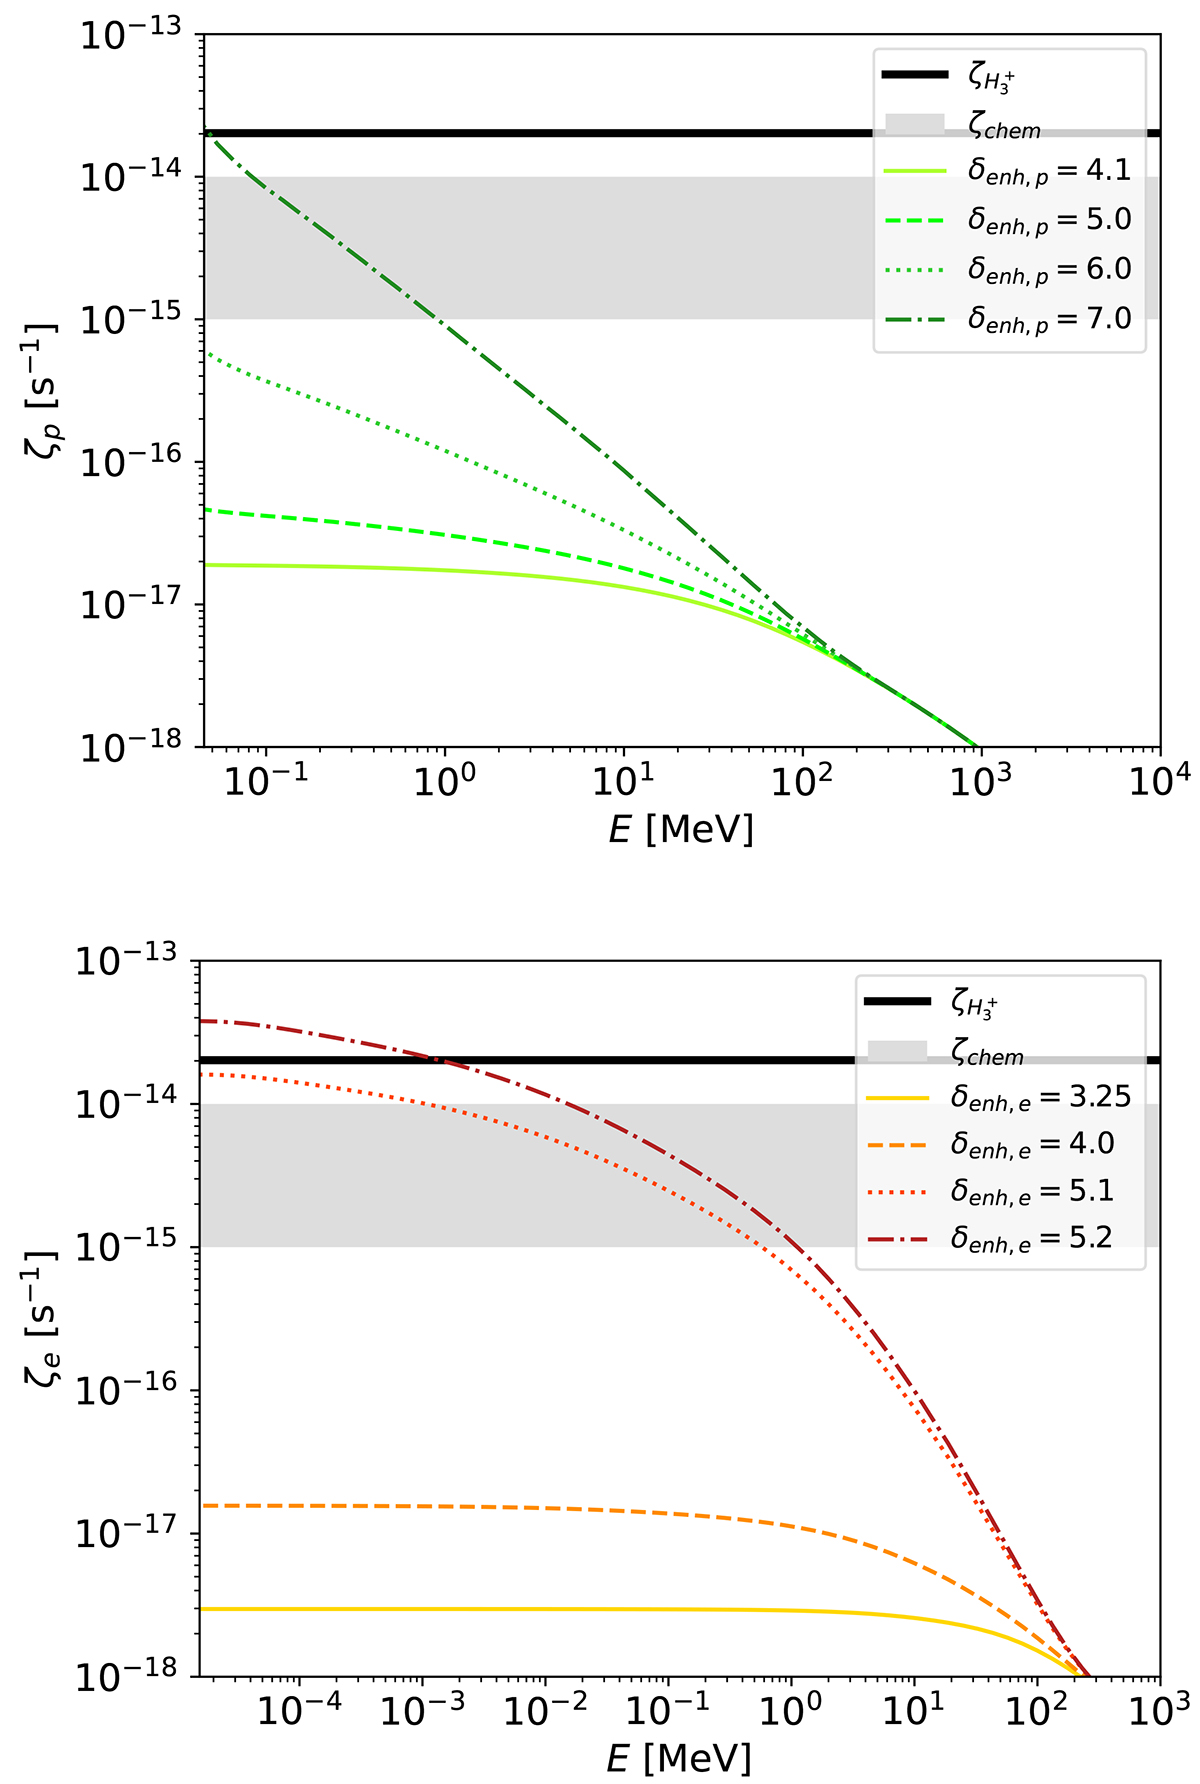
Fig. 8.
Download original image
CR proton (top) and electron (bottom) ionisation rates as a function of the minimum particle energy considered for the CR spectra shown in Fig. 7. Values were averaged over the CMZ volume and compared to the estimated values of ionisation rates derived by different observational methods (horizontal black line and shaded region).
Current usage metrics show cumulative count of Article Views (full-text article views including HTML views, PDF and ePub downloads, according to the available data) and Abstracts Views on Vision4Press platform.
Data correspond to usage on the plateform after 2015. The current usage metrics is available 48-96 hours after online publication and is updated daily on week days.
Initial download of the metrics may take a while.