Fig. 6
Download original image
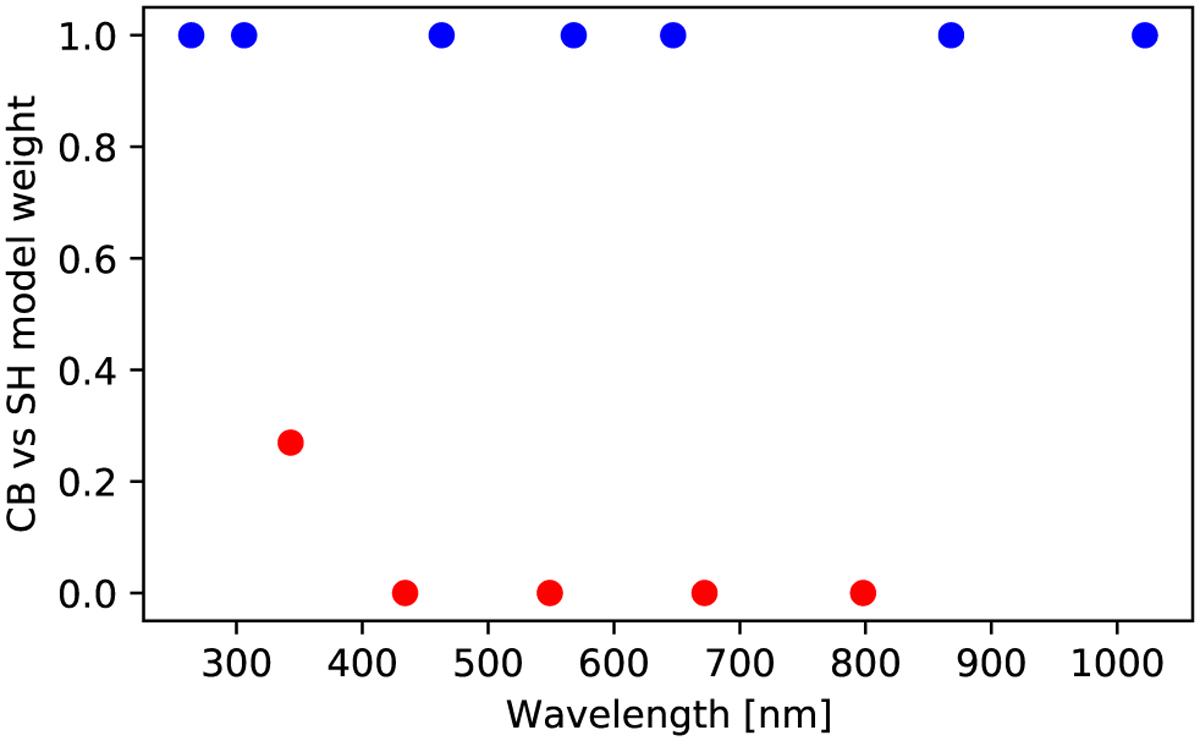
LOO model weight of the CB model vs. the SH model for the Enceladus phase curves. When the model weight is close to 1, then the CB model is preferred (blue points), however close to 0 indicates that SH is preferred (red points). The red points show the phase curves where the SH model is confirmed. Bottom panel shows the LOO model weight plotted against the number of datapoints in each phase curve. There is a tentative negative correlation here, indicating that the more datapoints in a phase curve, the stronger the SH model is preferred.
Current usage metrics show cumulative count of Article Views (full-text article views including HTML views, PDF and ePub downloads, according to the available data) and Abstracts Views on Vision4Press platform.
Data correspond to usage on the plateform after 2015. The current usage metrics is available 48-96 hours after online publication and is updated daily on week days.
Initial download of the metrics may take a while.