Fig. 5
Download original image
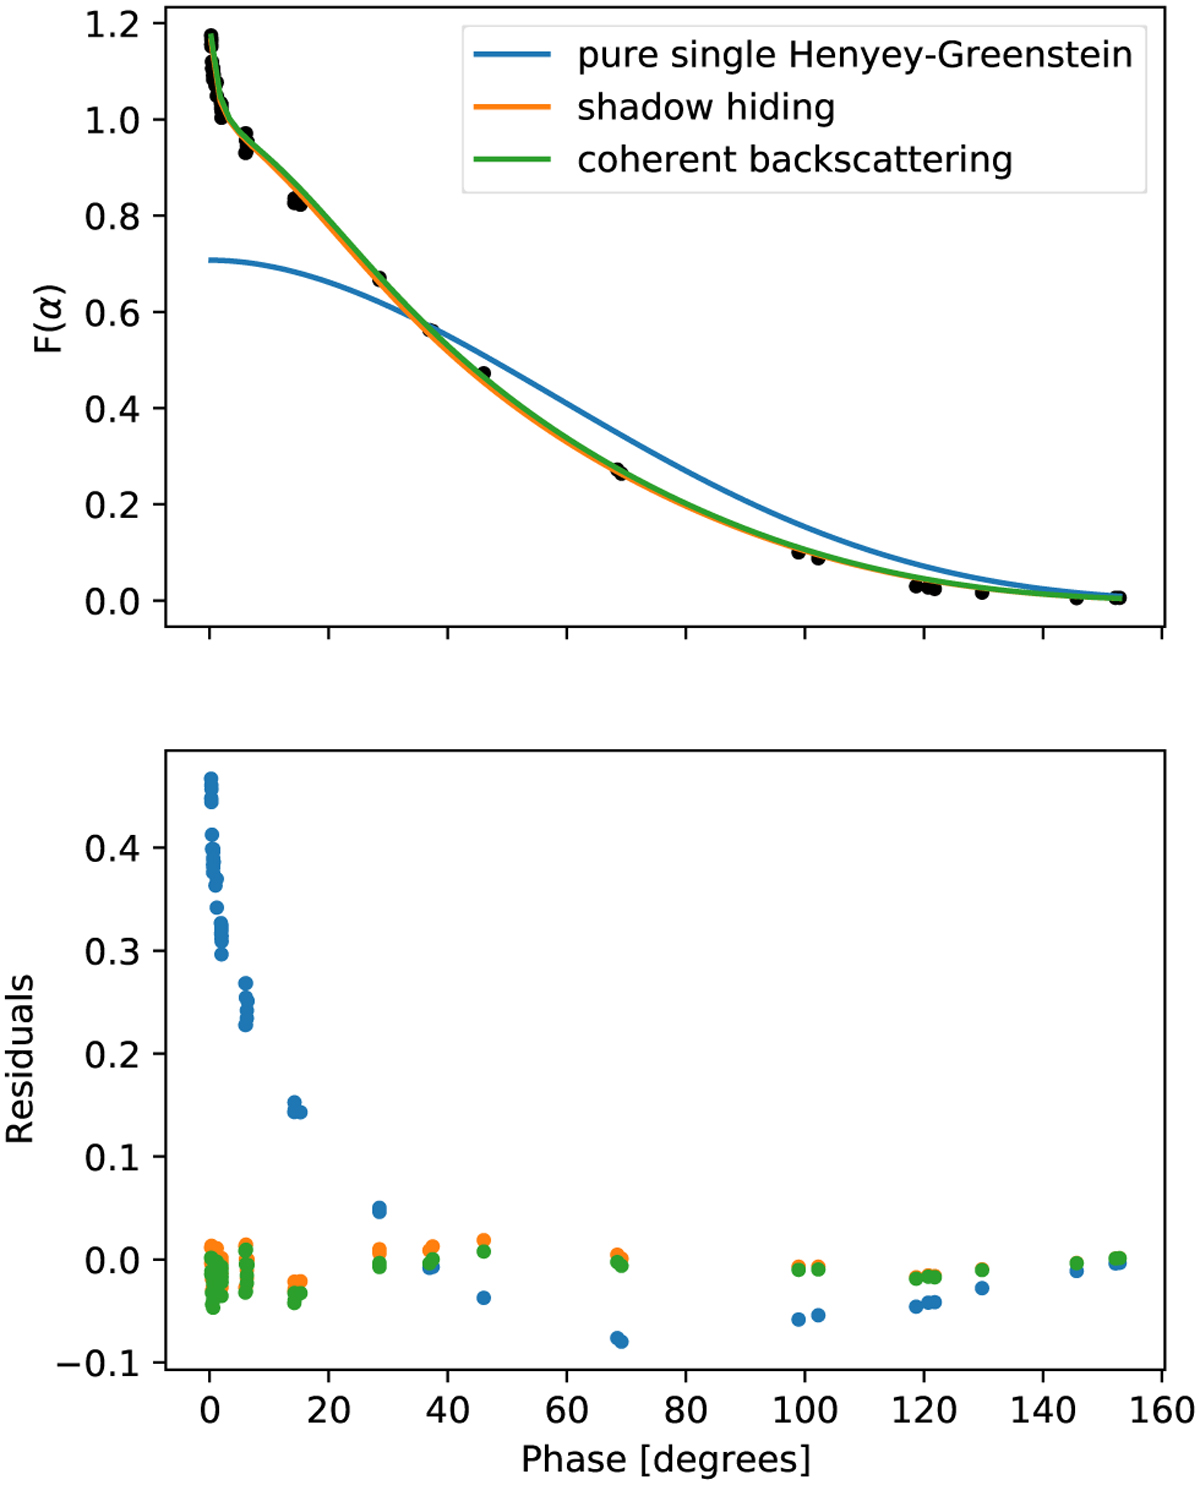
Best fit models to one of one of Enceladus’ phase curves (filter 798 nm) for three different models: a pure single Henyey-Greenstein model with no additional opposition peak, shadow hiding model, and coherent backscattering model. Top panel shows the fits and the second panel shows the residuals of these best fits. It is clear that the model with no opposition peak is the worst fit to the data. The other two models produce, by eye, almost identical fits, which is expected since the functional forms are similar. However the residuals still show subtle differences. Using the LOO model selection statistic allows us to conclude that the coherent backscattering model is preferred by 7/12 of the phase curves, however not significantly. The corner plot showing the posteriors for the shadow hiding model are in Appendix A, Figure A.2.
Current usage metrics show cumulative count of Article Views (full-text article views including HTML views, PDF and ePub downloads, according to the available data) and Abstracts Views on Vision4Press platform.
Data correspond to usage on the plateform after 2015. The current usage metrics is available 48-96 hours after online publication and is updated daily on week days.
Initial download of the metrics may take a while.