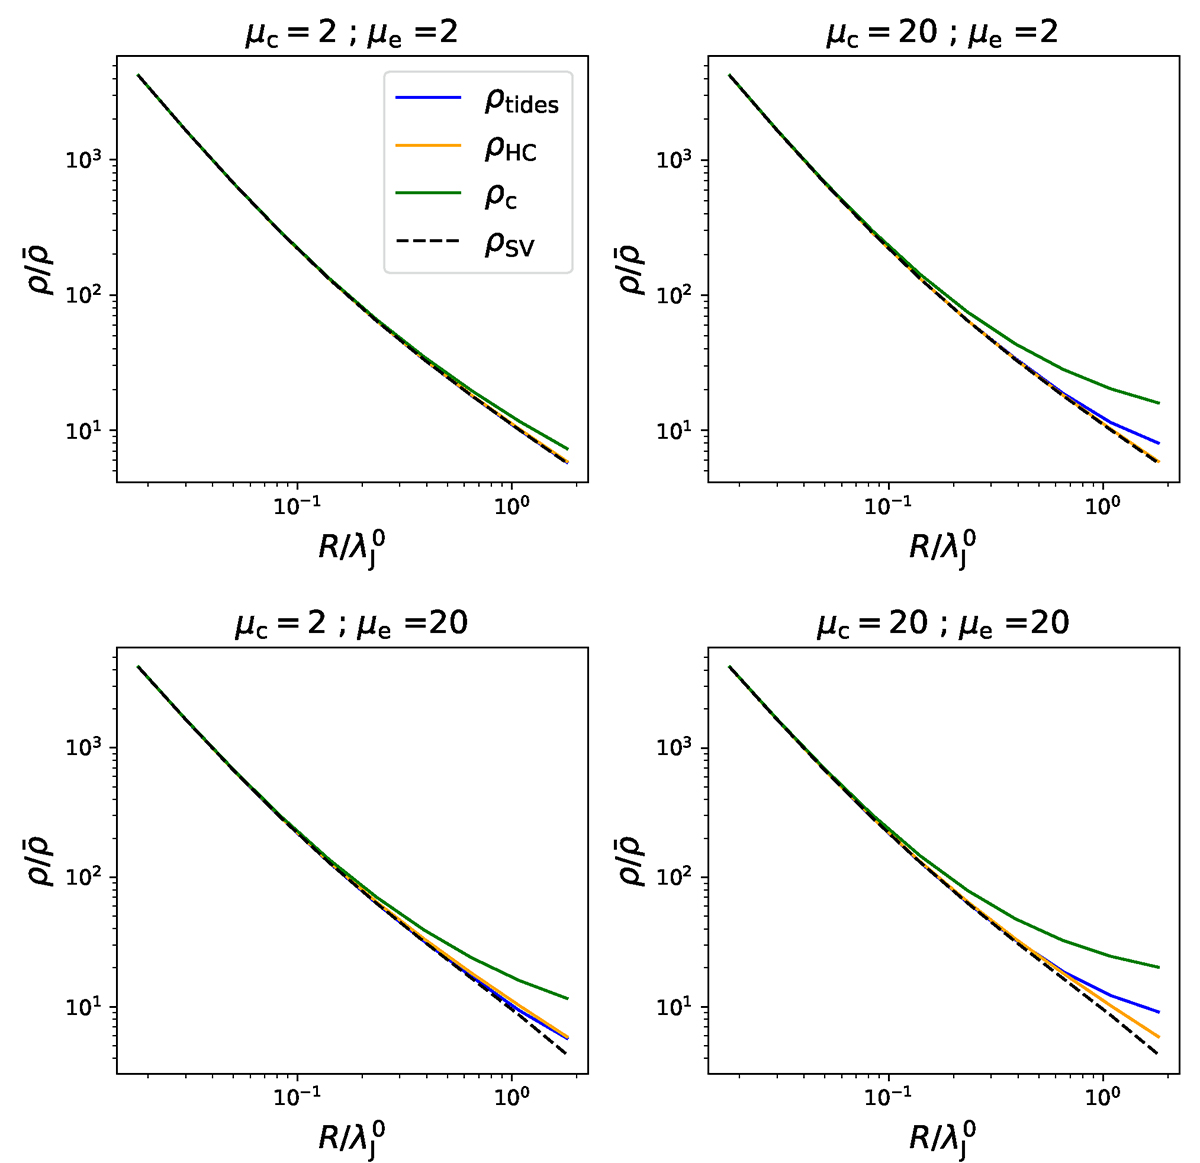
Fig. 3.
Download original image
Collapsing barrier (blue line) for different tidal field strengths based on the evolution of the triaxial ellipsoid. This barrier is compared with the barrier computed by Hennebelle & Chabrier (2008) without tides (orange line), the critical density for collapse of the c axis (green line) as in Colman & Teyssier (2020), and the global critical density, ρSV, computed from the scalar virial theorem (dashed black line).
Current usage metrics show cumulative count of Article Views (full-text article views including HTML views, PDF and ePub downloads, according to the available data) and Abstracts Views on Vision4Press platform.
Data correspond to usage on the plateform after 2015. The current usage metrics is available 48-96 hours after online publication and is updated daily on week days.
Initial download of the metrics may take a while.