Fig. 19
Download original image
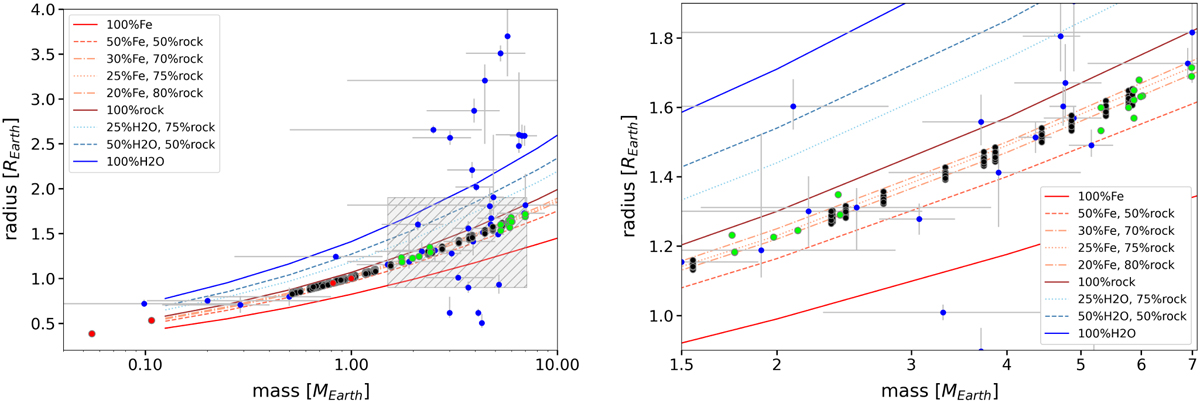
Mass-radius diagram (on the left) showing the simulated planetary sample (black circles, often partially overlapping), assuming the formation time of 0.2 Myr, together with the observed K-dwarf population (blue circles with gray error bars), and the terrestrial Solar System planets for comparison (red circles). Some of the simulated Ca- and Al-rich(er) planets are also displayed (light-green circles). The compositional curves are from Zeng et al. (2016). The plot on the right is just a zoomed-in version of the gray dashed region in the left diagram.
Current usage metrics show cumulative count of Article Views (full-text article views including HTML views, PDF and ePub downloads, according to the available data) and Abstracts Views on Vision4Press platform.
Data correspond to usage on the plateform after 2015. The current usage metrics is available 48-96 hours after online publication and is updated daily on week days.
Initial download of the metrics may take a while.