Fig. 12
Download original image
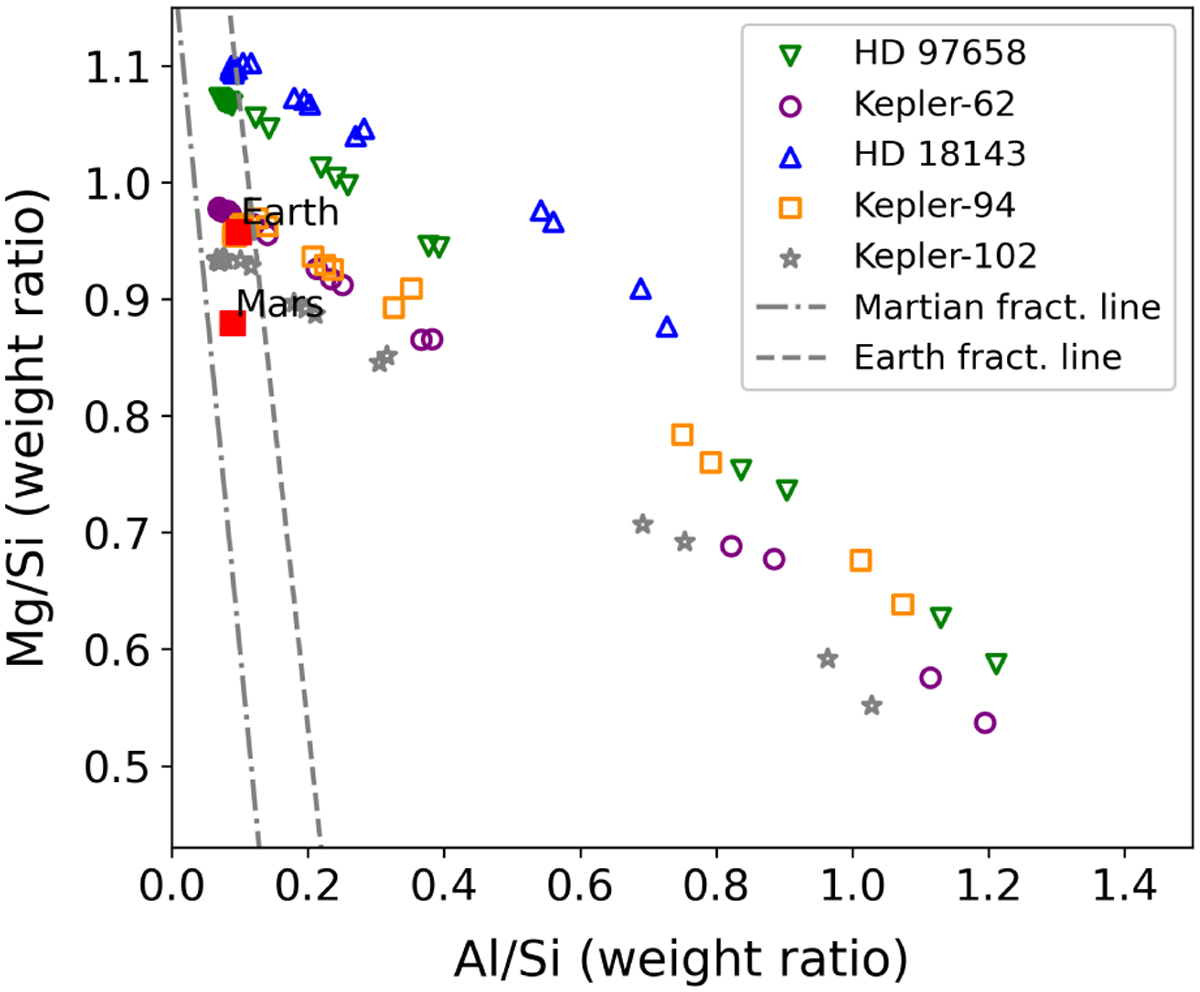
Mg/Si versus Al/Si weight ratios for the sample of the simulated planets around four different stars. In the plot, more than 80% of the data points with Al/Si closest to 0 for each star actually overlap, so only the planets with higher Al/Si are fully and individually displayed. The values for the Earth (McDonough 2014) and Mars (Yoshizaki & McDonough 2020) are shown for reference, together with their frac-tionation lines (the gray dashed lines). The planetesimal formation time of 0.8 Myr is assumed here.
Current usage metrics show cumulative count of Article Views (full-text article views including HTML views, PDF and ePub downloads, according to the available data) and Abstracts Views on Vision4Press platform.
Data correspond to usage on the plateform after 2015. The current usage metrics is available 48-96 hours after online publication and is updated daily on week days.
Initial download of the metrics may take a while.