Fig. 9
Download original image
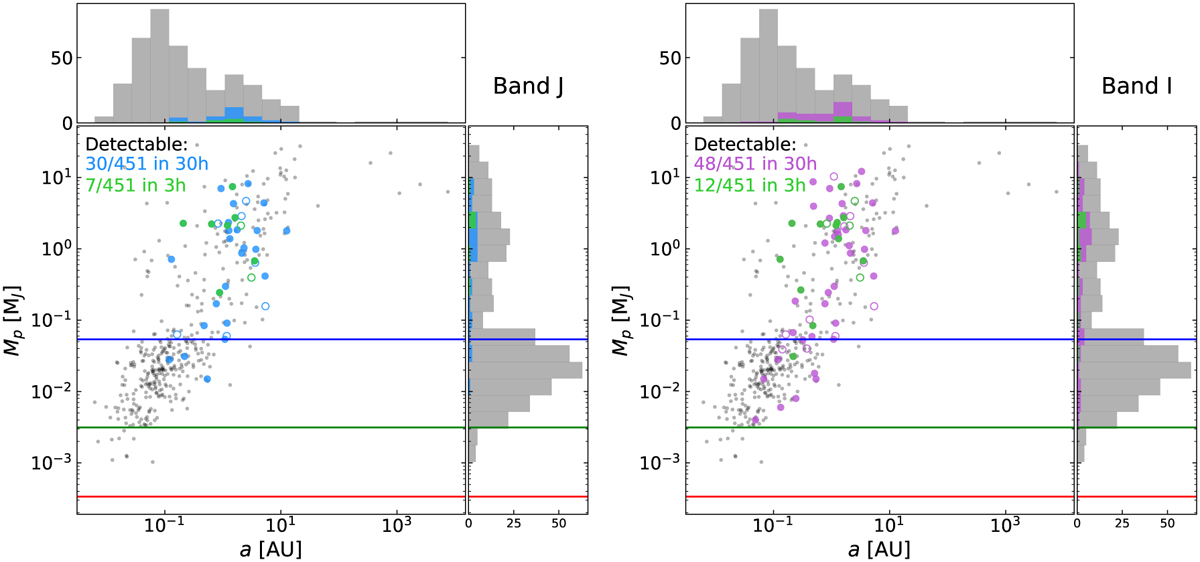
Detectable exoplanets with the current four-UT configuration with a 100 m baseline (left) at the J band and the proposed five-UT with 200 m baselines (right) at the I band. Blue and purple circles and histograms show the detectable planets in 30 h of integration time in each case, and green ones correspond to planets detectable in 3 h. Empty circles indicate planets that could be detectable by such an instrument but are out of the Dec ∈ {−90°, +30°} interval observable from Paranal, and thus not included in the tally of detectable planets. Grey dots and histograms show the ensemble of known exoplanets within 30 pc. For non-detectable exoplanets, we plot either Mp or Mp sin i as reported in the NASA Archive. Horizontal lines indicate the masses of Neptune (blue), Earth (green) and Mars (red).
Current usage metrics show cumulative count of Article Views (full-text article views including HTML views, PDF and ePub downloads, according to the available data) and Abstracts Views on Vision4Press platform.
Data correspond to usage on the plateform after 2015. The current usage metrics is available 48-96 hours after online publication and is updated daily on week days.
Initial download of the metrics may take a while.