Fig. 6
Download original image
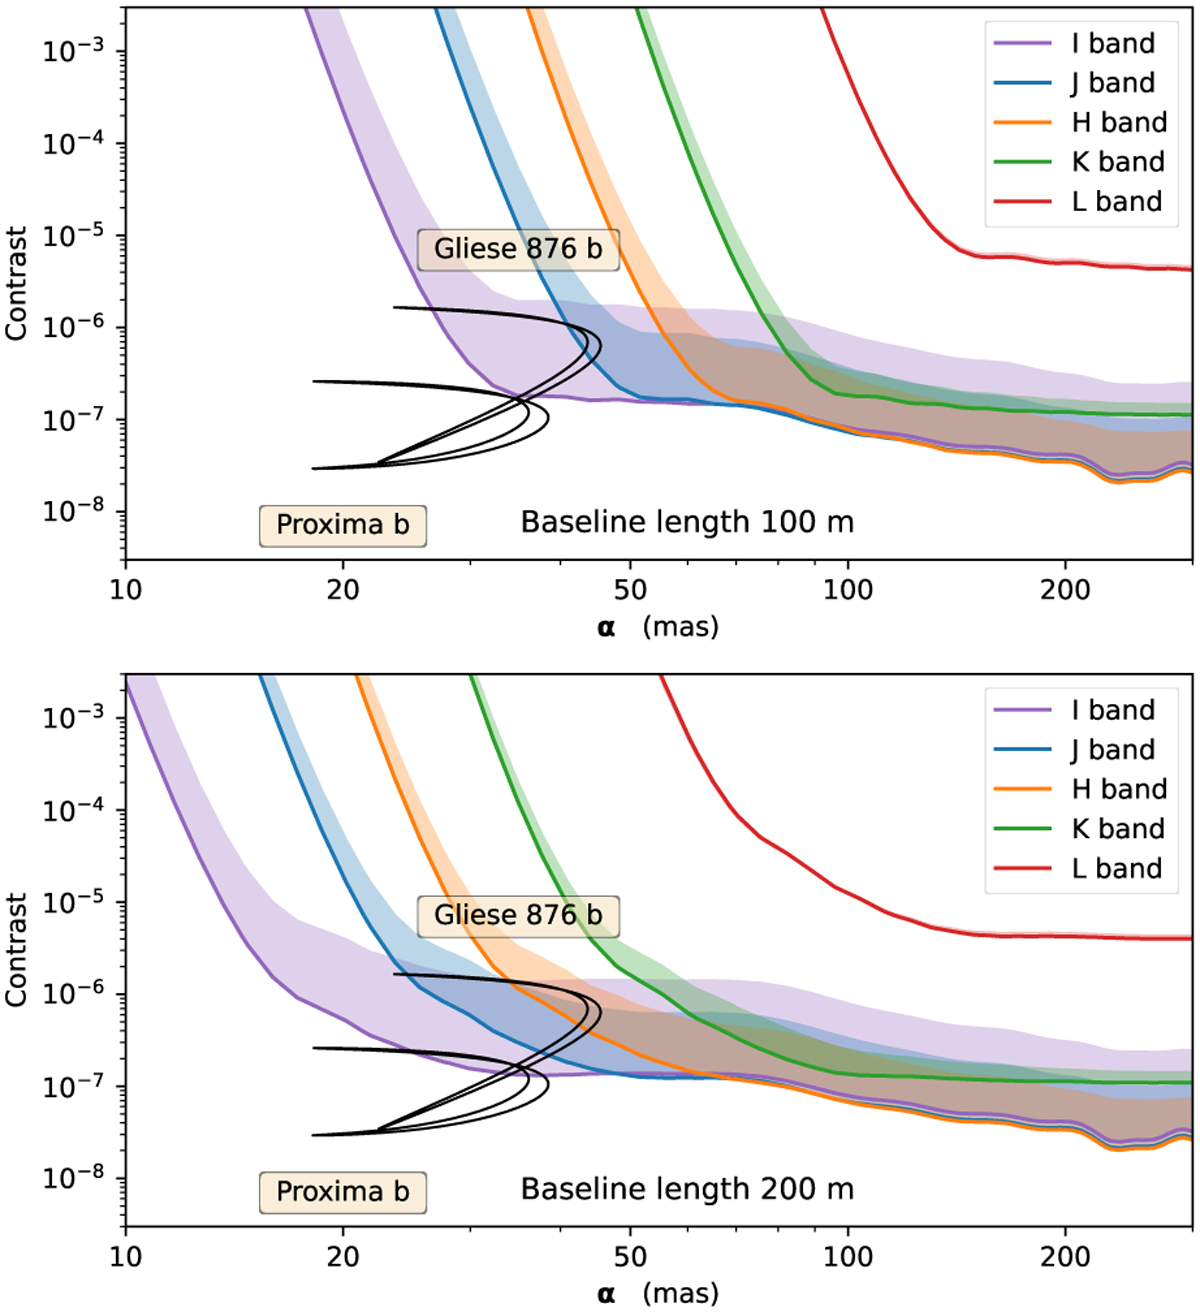
Contrast limit as a function of angular separation, with simulation parameters detailed in Table 2. The upper panel illustrates the contrast dependence on waveband for a 100m baseline. The lower panel displays the contrast limits for a 200 m baseline. The shaded area represents a range of K band Strehl ratios, from 88% (worse contrast limit) to 98% (best contrast limit). At short wavelength, the contrast range is limited by the Strehl. In the K and L bands, the contrast range is predominantly limited by thermal background noise. The inner working angles are constrained by both the telescope’s point spread function and the interferometric resolution, both linear function of wavelength.
Current usage metrics show cumulative count of Article Views (full-text article views including HTML views, PDF and ePub downloads, according to the available data) and Abstracts Views on Vision4Press platform.
Data correspond to usage on the plateform after 2015. The current usage metrics is available 48-96 hours after online publication and is updated daily on week days.
Initial download of the metrics may take a while.