Fig. 5
Download original image
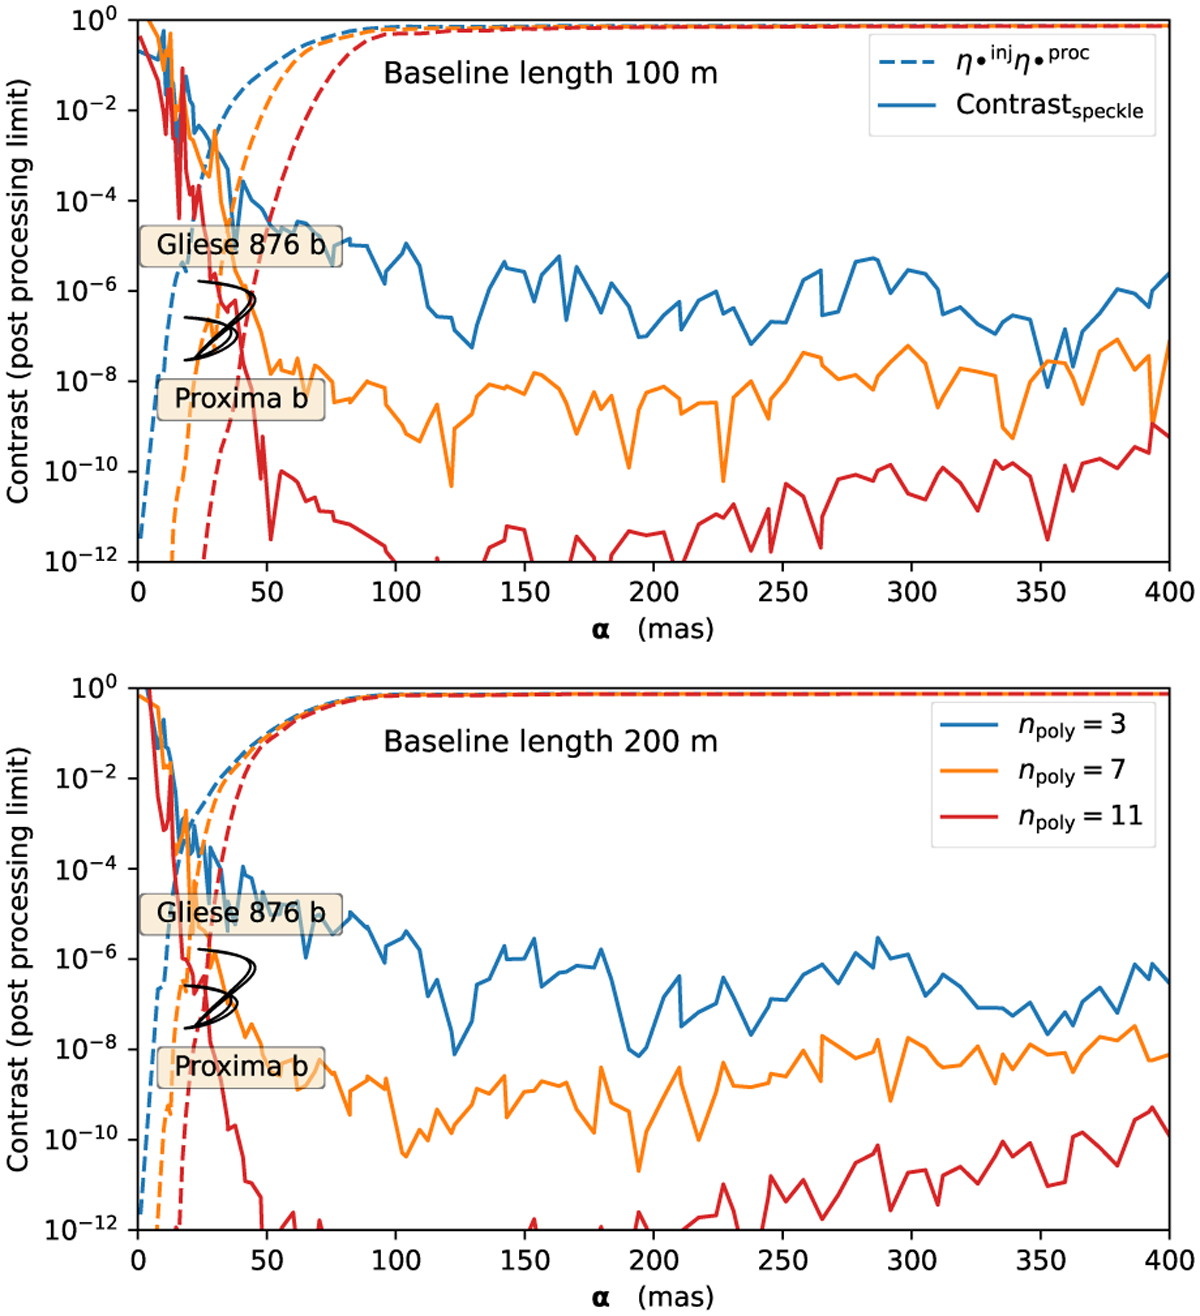
Attenuation of the exoplanet signal (![]() , in dashed lines) and the corresponding contrast limit (
, in dashed lines) and the corresponding contrast limit (![]() , in solid lines) after post-processing of the stellar speckle, as a function of angular separation. The three colour curves represent three levels of polynomial fitting strength (npoly of 3, 7, and 11) used for filtering the coherent speckles. The dotted curves show the attenuation of the exoplanet signal, illustrating that a lower polynomial order yield a smaller inner working angle. The solid curves indicate the contrast limit after post-processing of the stellar speckle, demonstrating that higher polynomial orders result in a better contrast limit. The upper plot represents observations with a 100m baseline, while the lower plot corresponds to a 200 m interferometer baseline.
, in solid lines) after post-processing of the stellar speckle, as a function of angular separation. The three colour curves represent three levels of polynomial fitting strength (npoly of 3, 7, and 11) used for filtering the coherent speckles. The dotted curves show the attenuation of the exoplanet signal, illustrating that a lower polynomial order yield a smaller inner working angle. The solid curves indicate the contrast limit after post-processing of the stellar speckle, demonstrating that higher polynomial orders result in a better contrast limit. The upper plot represents observations with a 100m baseline, while the lower plot corresponds to a 200 m interferometer baseline.
Current usage metrics show cumulative count of Article Views (full-text article views including HTML views, PDF and ePub downloads, according to the available data) and Abstracts Views on Vision4Press platform.
Data correspond to usage on the plateform after 2015. The current usage metrics is available 48-96 hours after online publication and is updated daily on week days.
Initial download of the metrics may take a while.