Fig. 4

Download original image
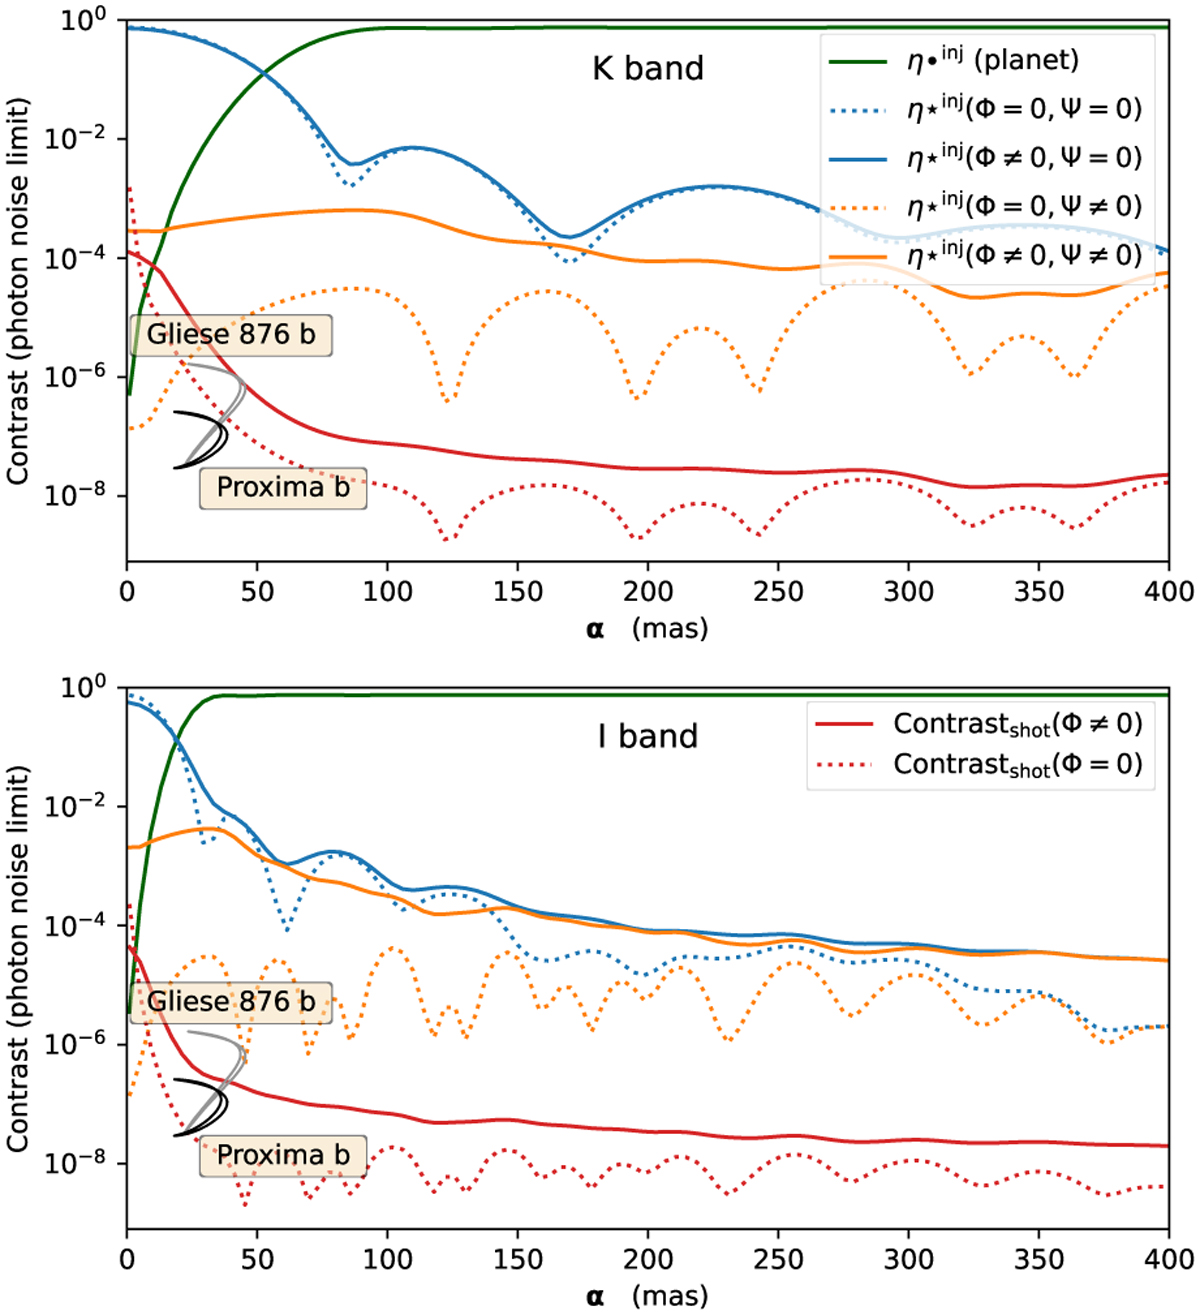
Apodization due to the spatial filtering caused by single-mode fibres as a function of the angular separation α between the star and the exoplanet, in the K band (upper panel) and in the I band (lower panel). The green curves show ![]() , the injection of the exoplanet flux into interferometer 2, while the blue and orange curves represent the injection of the stellar flux
, the injection of the exoplanet flux into interferometer 2, while the blue and orange curves represent the injection of the stellar flux ![]() . The blue curves are without a phase apodization (Ψα = 0), while the orange curves are with phase apodization (Ψα = aH1 + bH2). The solid curves include the residuals of atmospheric correction by an extreme AO system, giving a Strehl ratio of 98% in the K band and 72% in the I band. The dotted curves are obtained assuming no atmospheric residuals: Φ(u) = 0, hence a Strehl ratio of 100%. The red curves correspond to the contrast limit, Cshot in Eq. (56), that would be achieved when limited by photon noise, for an observation with parameters as stipulated in Table 2. The phase apodizer is efficient at decreasing the flux injected into the fibre in the K band. However, at shorter wavelengths, the lower Strehl ratio makes it less effective, with the injected flux mostly due to the atmospheric halo.
. The blue curves are without a phase apodization (Ψα = 0), while the orange curves are with phase apodization (Ψα = aH1 + bH2). The solid curves include the residuals of atmospheric correction by an extreme AO system, giving a Strehl ratio of 98% in the K band and 72% in the I band. The dotted curves are obtained assuming no atmospheric residuals: Φ(u) = 0, hence a Strehl ratio of 100%. The red curves correspond to the contrast limit, Cshot in Eq. (56), that would be achieved when limited by photon noise, for an observation with parameters as stipulated in Table 2. The phase apodizer is efficient at decreasing the flux injected into the fibre in the K band. However, at shorter wavelengths, the lower Strehl ratio makes it less effective, with the injected flux mostly due to the atmospheric halo.
Current usage metrics show cumulative count of Article Views (full-text article views including HTML views, PDF and ePub downloads, according to the available data) and Abstracts Views on Vision4Press platform.
Data correspond to usage on the plateform after 2015. The current usage metrics is available 48-96 hours after online publication and is updated daily on week days.
Initial download of the metrics may take a while.


