Fig. 3
Download original image
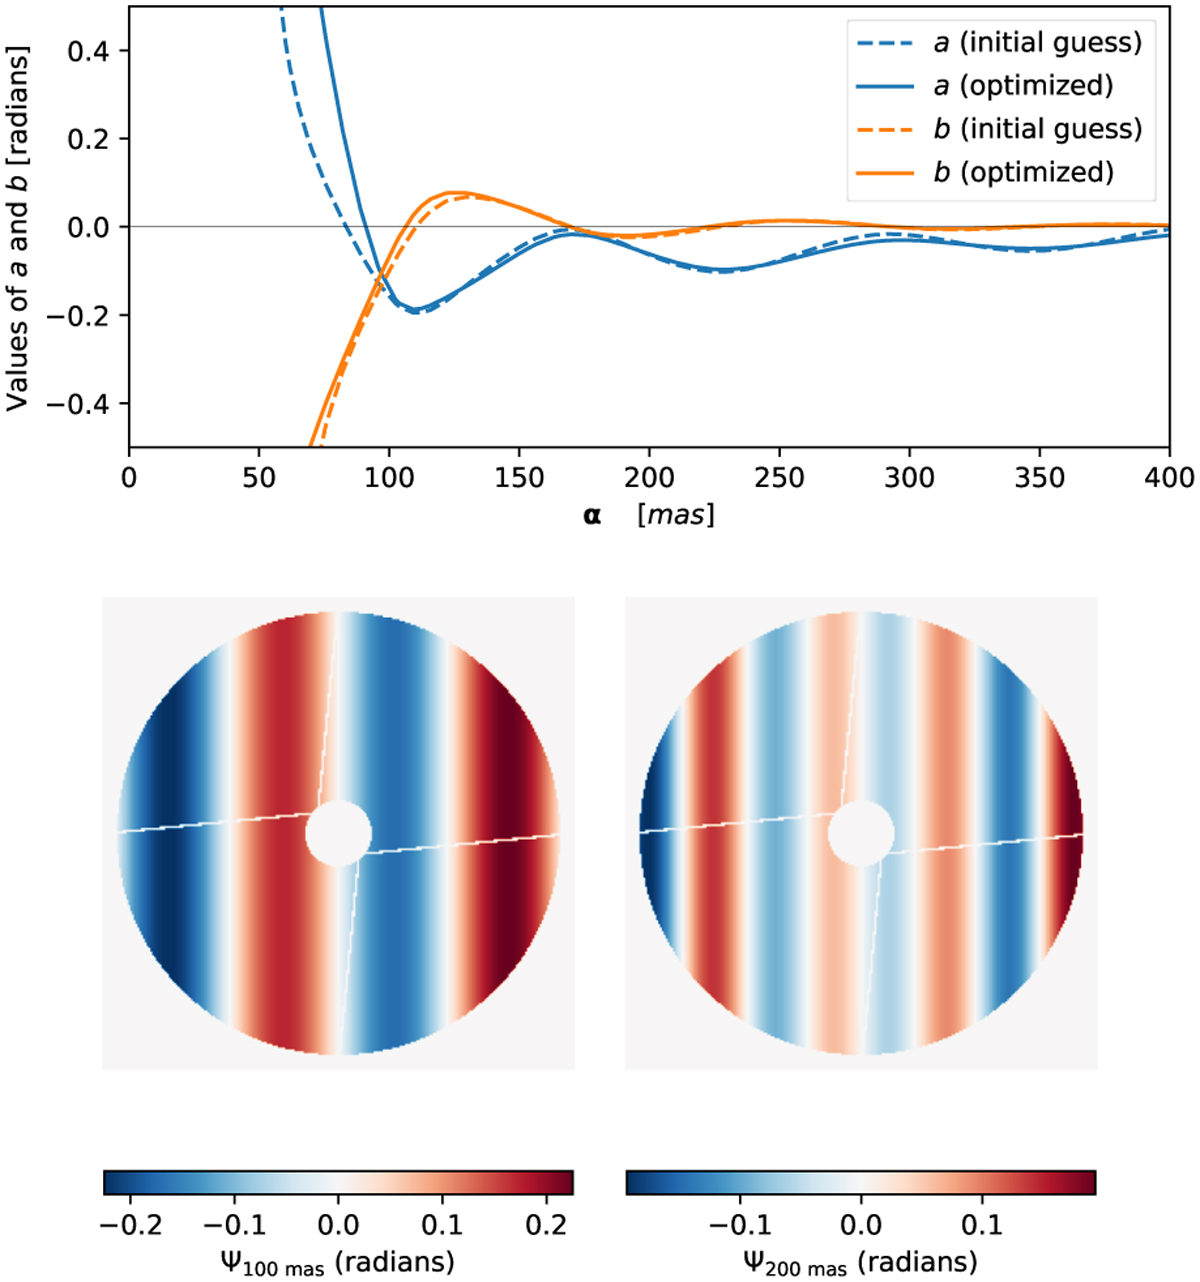
Phase maps for pupil plane apodization. Upper panel: coefficients (a, b) used to compute the phase apodizer as Ψα = aH1 + bH2. The solid lines show the optimised coefficient used in the final definition of the apodizer, i.e. the solution of Eq. (53). The dashed lines show the initial guess calculated from Eq. (51). The simulation has been made for K band observations (k0 = 2π/2.2 µm) and the shape of the VLT pupil. Lower panels : the apodizer function, Ψα (u), for a target at an angular separation of 100 mas (left panel) and 200 mas (right panel).
Current usage metrics show cumulative count of Article Views (full-text article views including HTML views, PDF and ePub downloads, according to the available data) and Abstracts Views on Vision4Press platform.
Data correspond to usage on the plateform after 2015. The current usage metrics is available 48-96 hours after online publication and is updated daily on week days.
Initial download of the metrics may take a while.