Fig. 2
Download original image
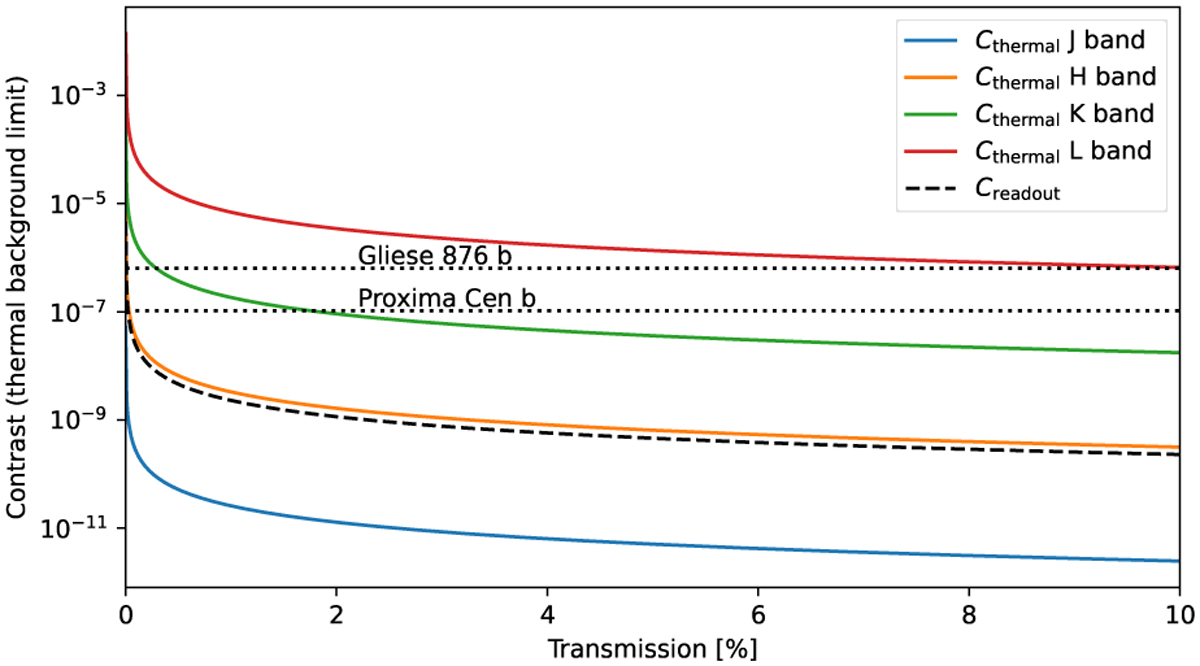
Contrast limit at the VLTI as a function of the transmission efficiency of the interferometer (Tr, in percents). The coloured curves represent theoretical contrast limits set by the thermal background of the telescope and interferometric laboratory (300 K). The dashed curves indicate the contrast limit from detector readout noise. The simulation parameters are detailed in Table 2.
Current usage metrics show cumulative count of Article Views (full-text article views including HTML views, PDF and ePub downloads, according to the available data) and Abstracts Views on Vision4Press platform.
Data correspond to usage on the plateform after 2015. The current usage metrics is available 48-96 hours after online publication and is updated daily on week days.
Initial download of the metrics may take a while.